UK power cut research: what the studies found

23 official reports and published statistics on power cuts, safety and coping at home, each summarised in one graphic with a link to the source.

Living without electricity: One city's experience of coping with loss of power
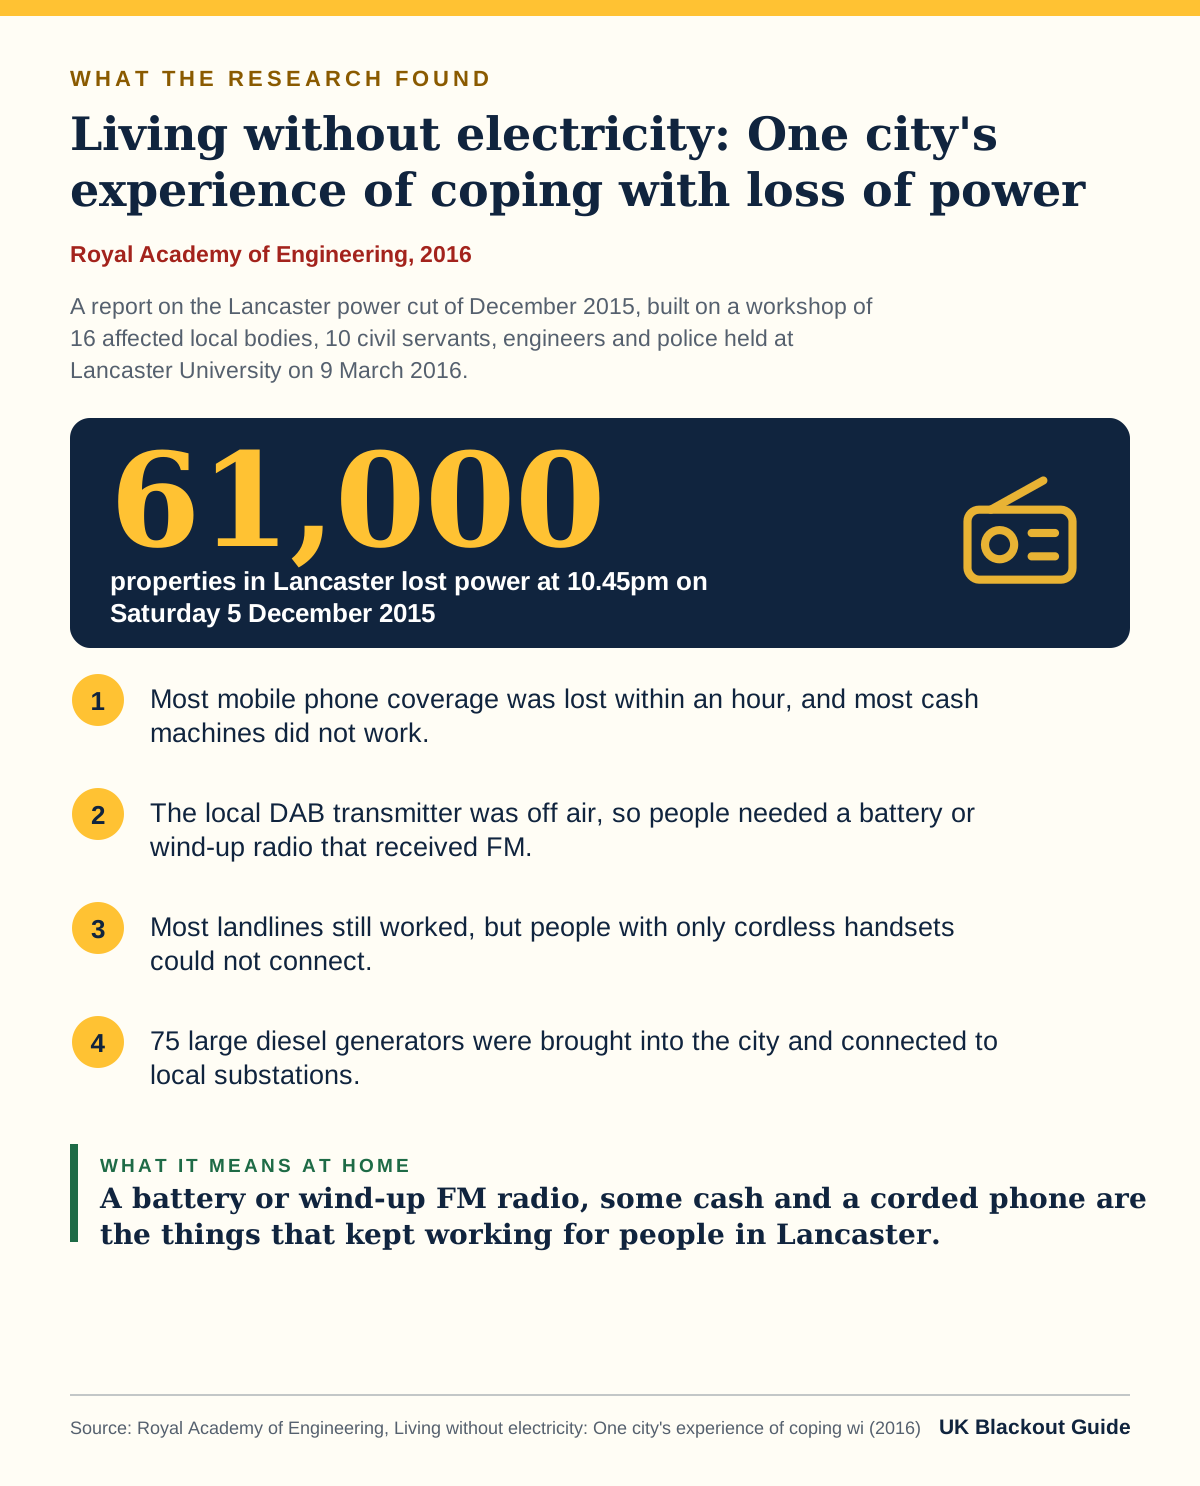
Infographic. Royal Academy of Engineering, 2016: Living without electricity: One city's experience of coping with loss of power. Key figure: 61,000 properties in Lancaster lost power at 10.45pm on Saturday 5 December 2015. Findings: Most mobile phone coverage was lost within an hour, and most cash machines did not work. The local DAB transmitter was off air, so people needed a battery or wind-up radio that received FM. Most landlines still worked, but people with only cordless handsets could not connect. 75 large diesel generators were brought into the city and connected to local substations.
Living without electricity: One city's experience of coping with loss of power, Royal Academy of Engineering (2016). Read the source · Download this graphic

A report on the Lancaster power cut of December 2015, built on a workshop of 16 affected local bodies, 10 civil servants, engineers and police held at Lancaster University on 9 March 2016. A battery or wind-up FM radio, some cash and a corded phone are the things that kept working for people in Lancaster.

These figures shape the advice in has the UK ever had a national blackout.

9 August 2019 power outage report
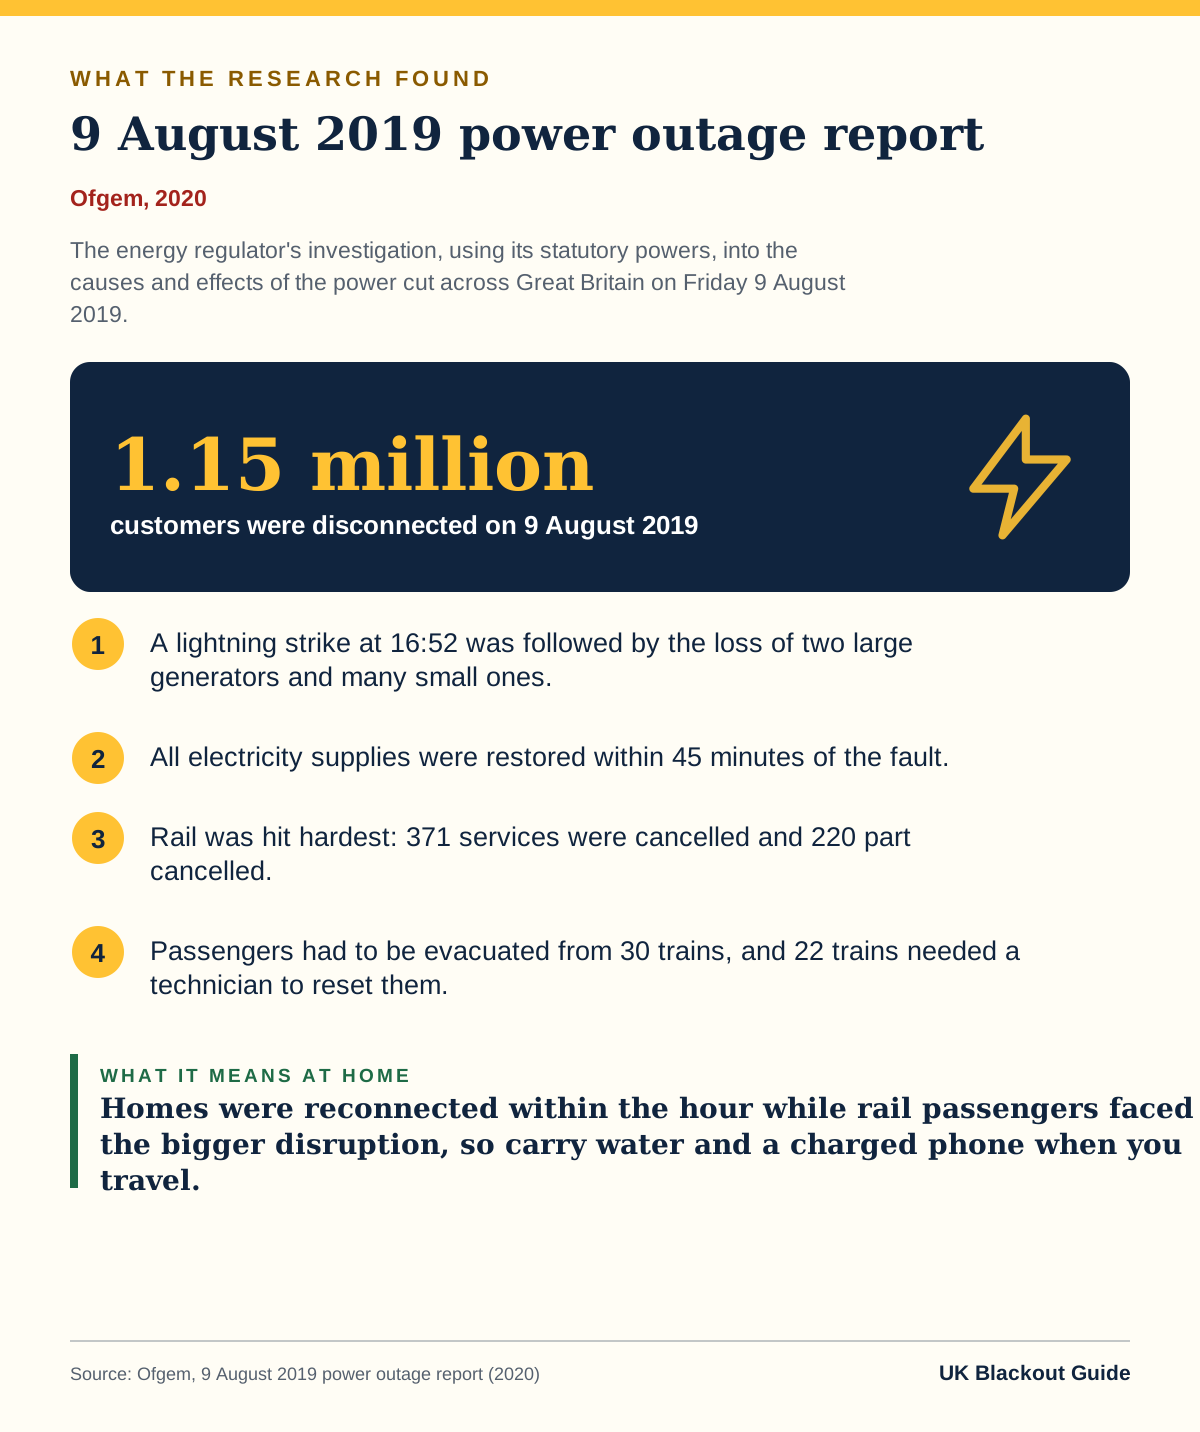
Infographic. Ofgem, 2020: 9 August 2019 power outage report. Key figure: 1.15 million customers were disconnected on 9 August 2019. Findings: A lightning strike at 16:52 was followed by the loss of two large generators and many small ones. All electricity supplies were restored within 45 minutes of the fault. Rail was hit hardest: 371 services were cancelled and 220 part cancelled. Passengers had to be evacuated from 30 trains, and 22 trains needed a technician to reset them.
9 August 2019 power outage report, Ofgem (2020). Read the source · Download this graphic

The energy regulator's investigation, using its statutory powers, into the causes and effects of the power cut across Great Britain on Friday 9 August 2019. Homes were reconnected within the hour while rail passengers faced the bigger disruption, so carry water and a charged phone when you travel.

For what to do with this at home, see how we use it in has the UK ever had a national blackout.

Energy Emergencies Executive Committee Storm Arwen Review: Final Report
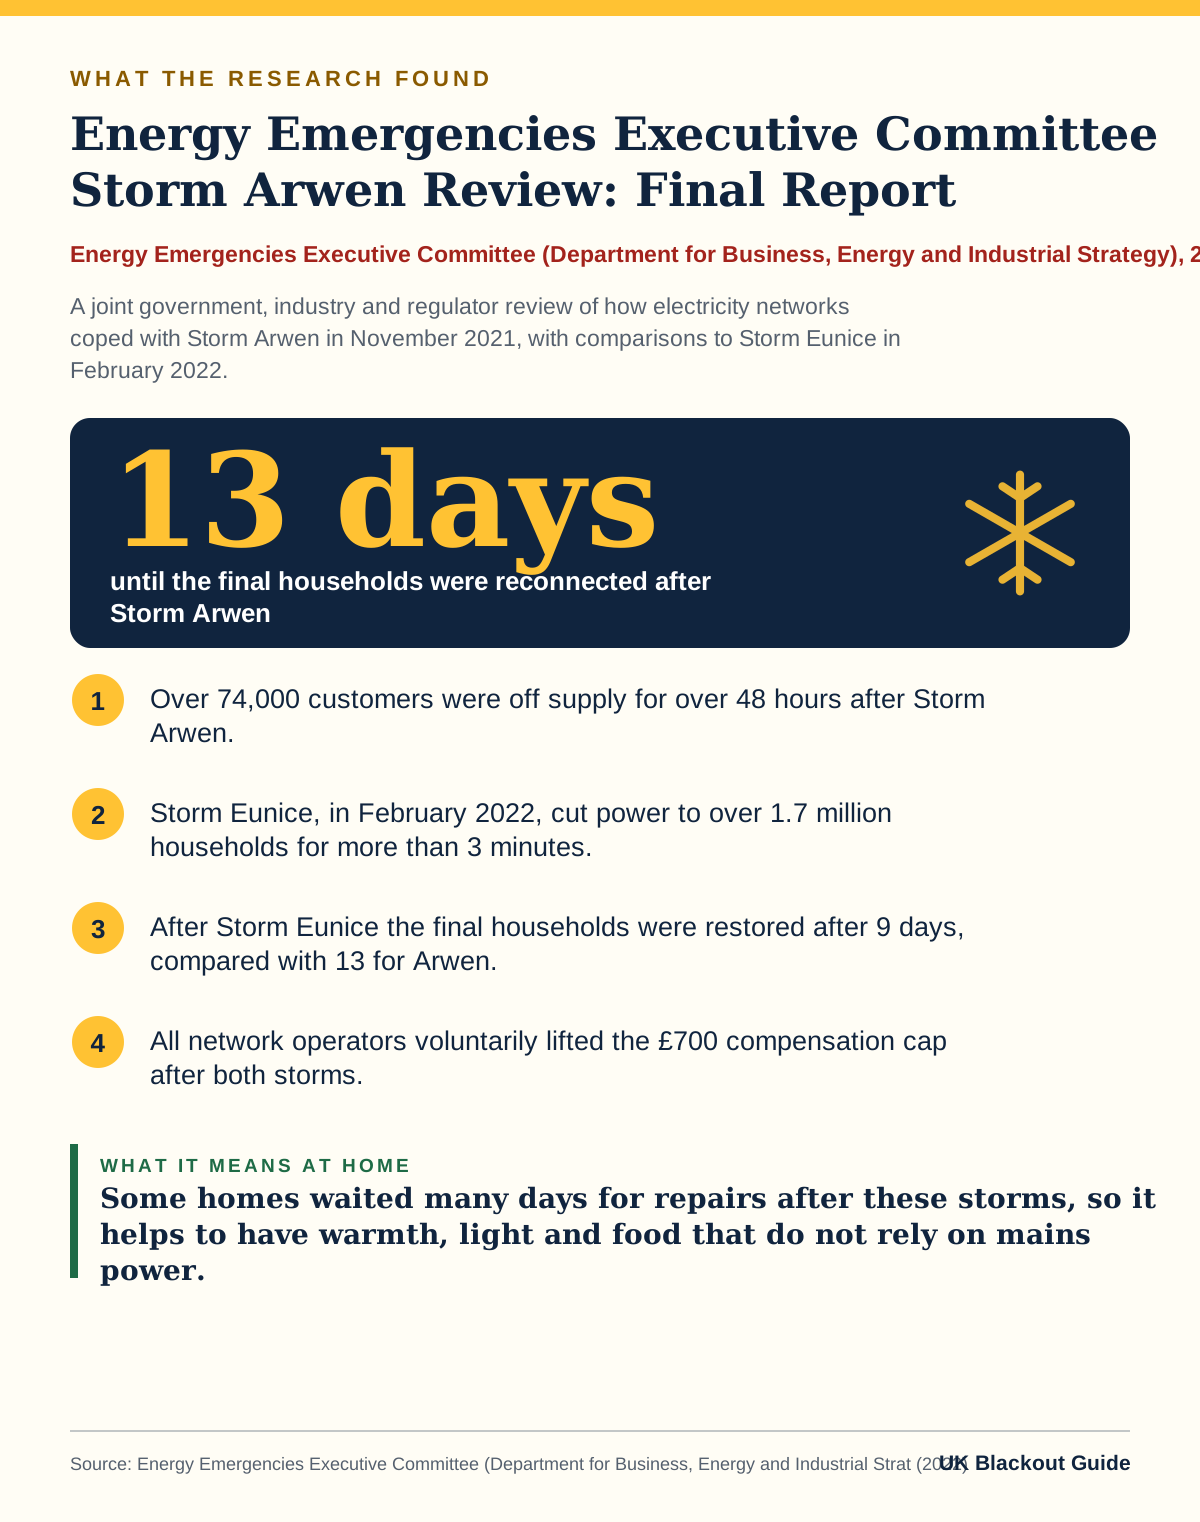
Infographic. Energy Emergencies Executive Committee (Department for Business, Energy and Industrial Strategy), 2022: Energy Emergencies Executive Committee Storm Arwen Review: Final Report. Key figure: 13 days until the final households were reconnected after Storm Arwen. Findings: Over 74,000 customers were off supply for over 48 hours after Storm Arwen. Storm Eunice, in February 2022, cut power to over 1.7 million households for more than 3 minutes. After Storm Eunice the final households were restored after 9 days, compared with 13 for Arwen. All network operators voluntarily lifted the £700 compensation cap after both storms.
Energy Emergencies Executive Committee Storm Arwen Review: Final Report, Energy Emergencies Executive Committee (Department for Business, Energy and Industrial Strategy) (2022). Read the source · Download this graphic

A joint government, industry and regulator review of how electricity networks coped with Storm Arwen in November 2021, with comparisons to Storm Eunice in February 2022. Some homes waited many days for repairs after these storms, so it helps to have warmth, light and food that do not rely on mains power.

The practical side of this evidence is covered in our page on what causes power cuts in the UK.

Final report on the review into the networks' response to Storm Arwen
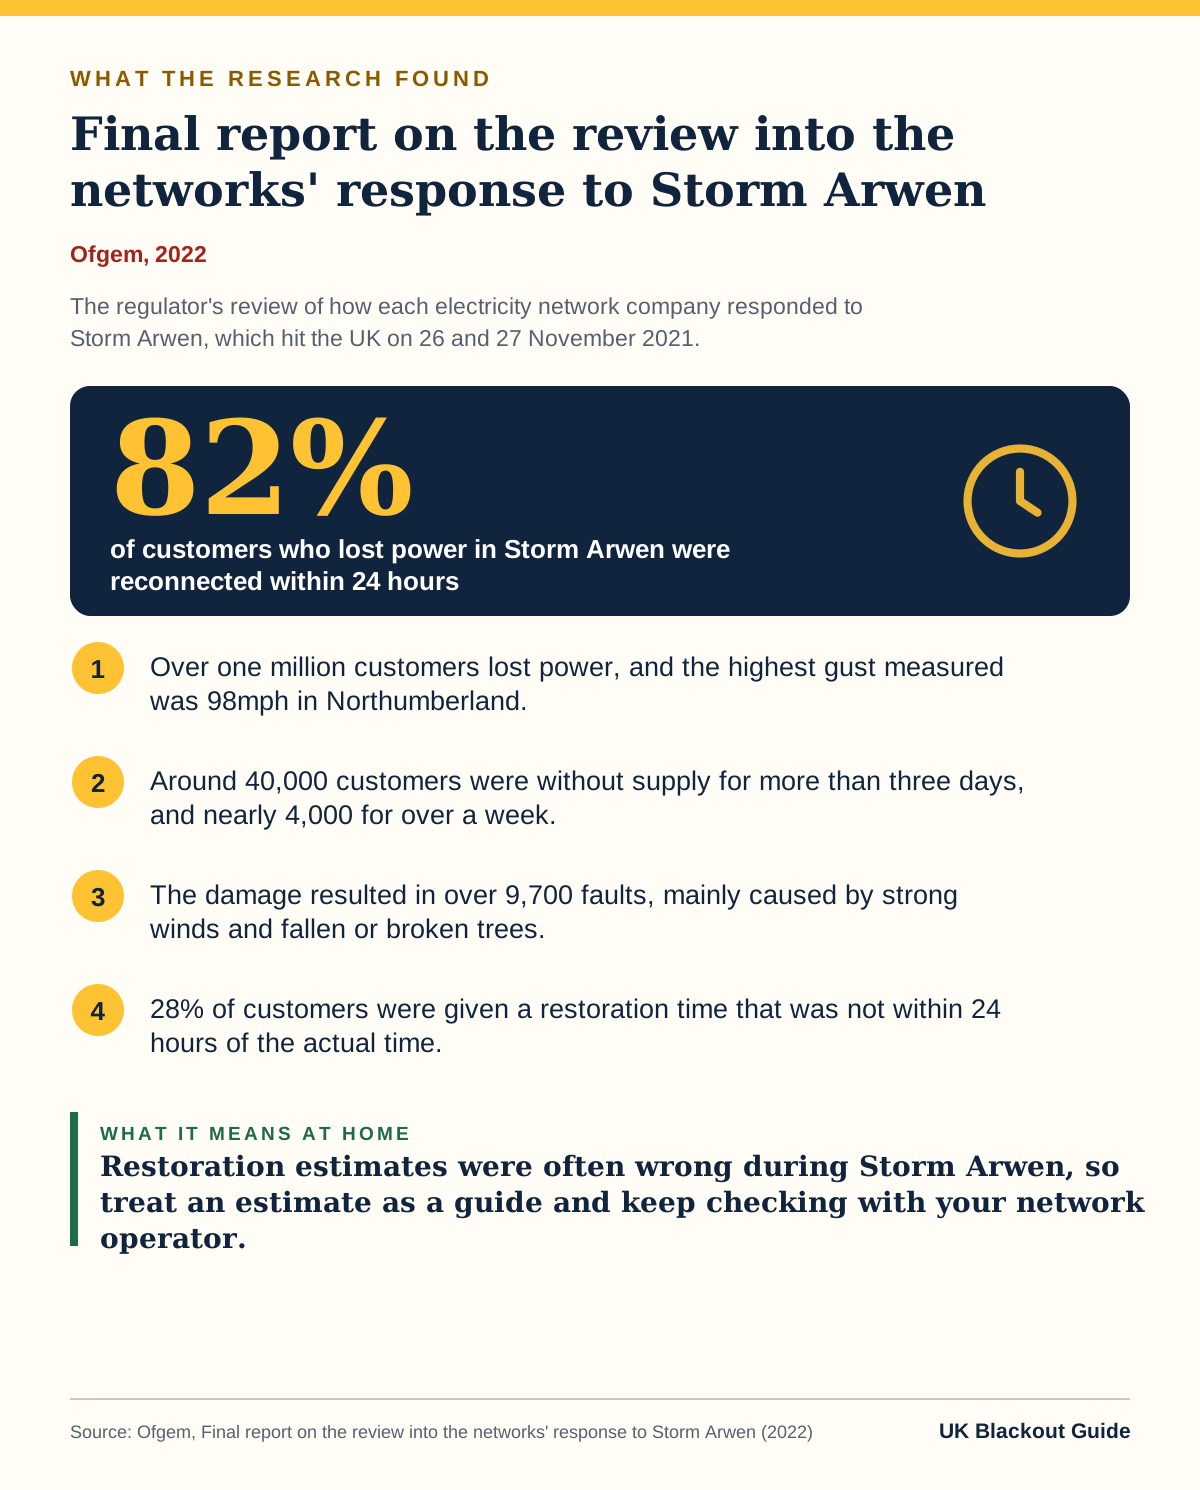
Infographic. Ofgem, 2022: Final report on the review into the networks' response to Storm Arwen. Key figure: 82% of customers who lost power in Storm Arwen were reconnected within 24 hours. Findings: Over one million customers lost power, and the highest gust measured was 98mph in Northumberland. Around 40,000 customers were without supply for more than three days, and nearly 4,000 for over a week. The damage resulted in over 9,700 faults, mainly caused by strong winds and fallen or broken trees. 28% of customers were given a restoration time that was not within 24 hours of the actual time.
Final report on the review into the networks' response to Storm Arwen, Ofgem (2022). Read the source · Download this graphic

The regulator's review of how each electricity network company responded to Storm Arwen, which hit the UK on 26 and 27 November 2021. Restoration estimates were often wrong during Storm Arwen, so treat an estimate as a guide and keep checking with your network operator.

For what to do with this at home, see how we use it in who do you call in a power cut.

Final Report on the Grid Incident in Spain and Portugal on 28 April 2025
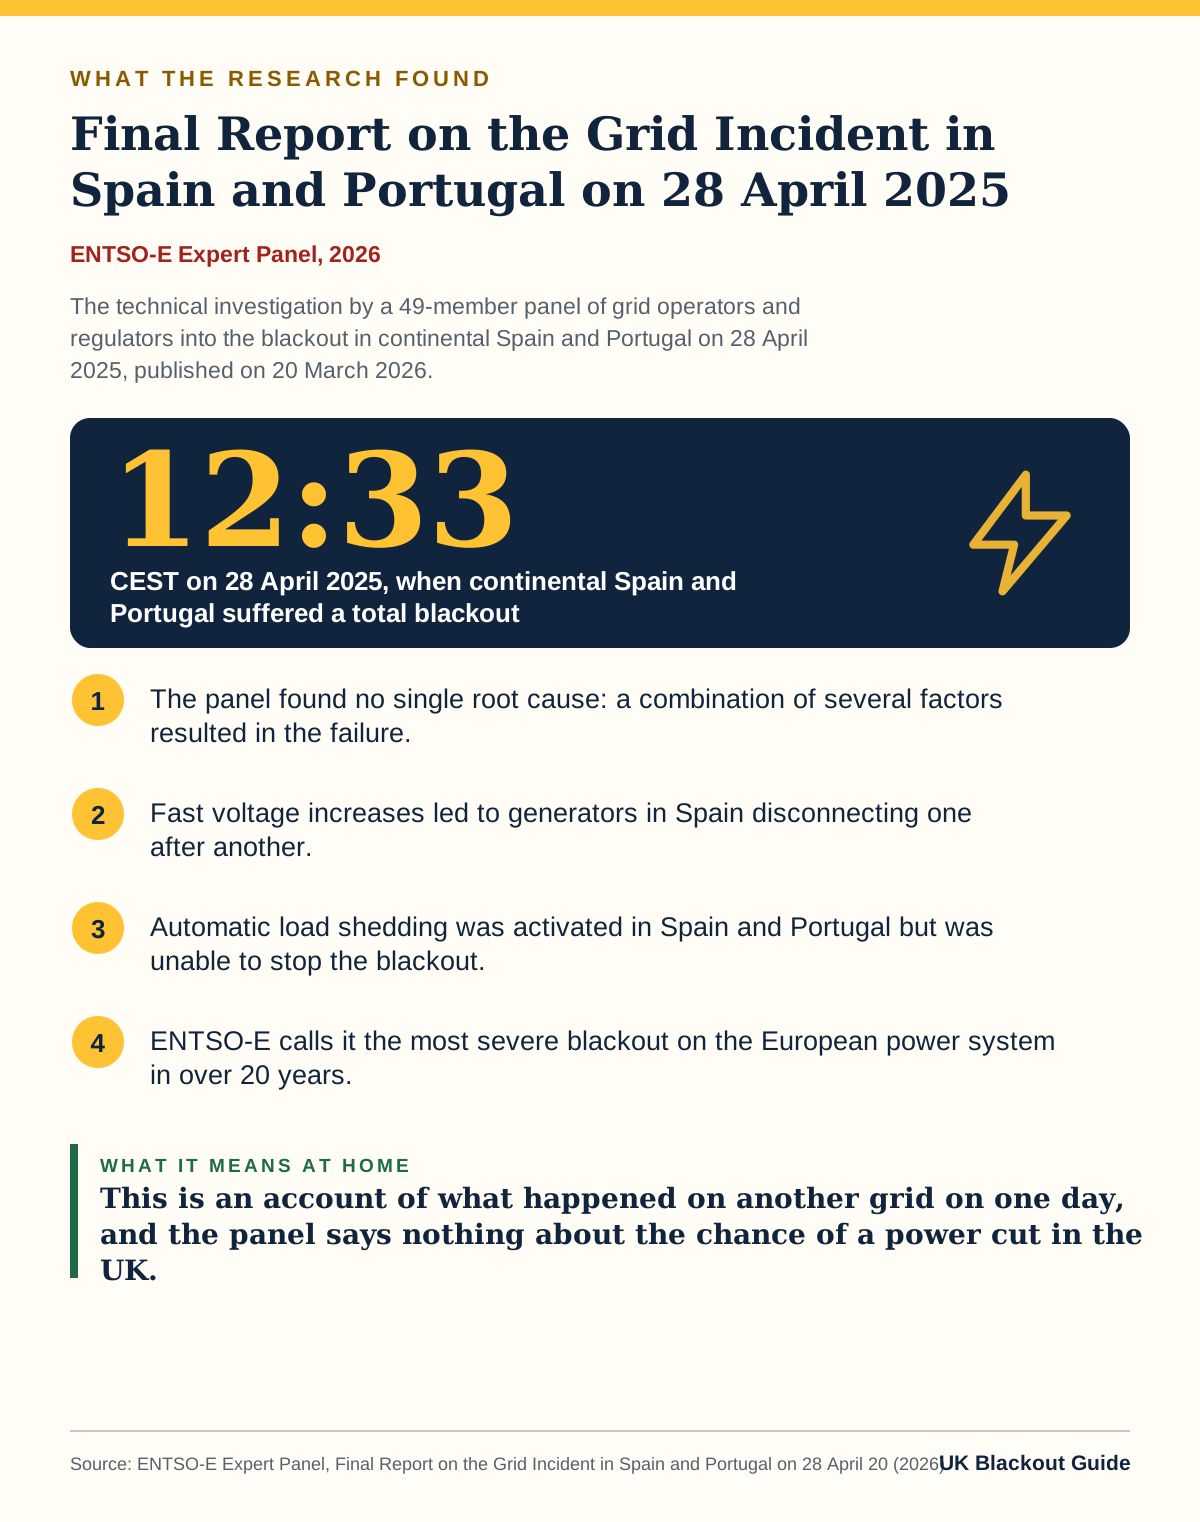
Infographic. ENTSO-E Expert Panel, 2026: Final Report on the Grid Incident in Spain and Portugal on 28 April 2025. Key figure: 12:33 CEST on 28 April 2025, when continental Spain and Portugal suffered a total blackout. Findings: The panel found no single root cause: a combination of several factors resulted in the failure. Fast voltage increases led to generators in Spain disconnecting one after another. Automatic load shedding was activated in Spain and Portugal but was unable to stop the blackout. ENTSO-E calls it the most severe blackout on the European power system in over 20 years.
Final Report on the Grid Incident in Spain and Portugal on 28 April 2025, ENTSO-E Expert Panel (2026). Read the source · Download this graphic

The technical investigation by a 49-member panel of grid operators and regulators into the blackout in continental Spain and Portugal on 28 April 2025, published on 20 March 2026. This is an account of what happened on another grid on one day, and the panel says nothing about the chance of a power cut in the UK.

For what to do with this at home, see how we use it in what causes power cuts in the UK.

Introducing a new 'Electricity System Restoration Standard': policy statement
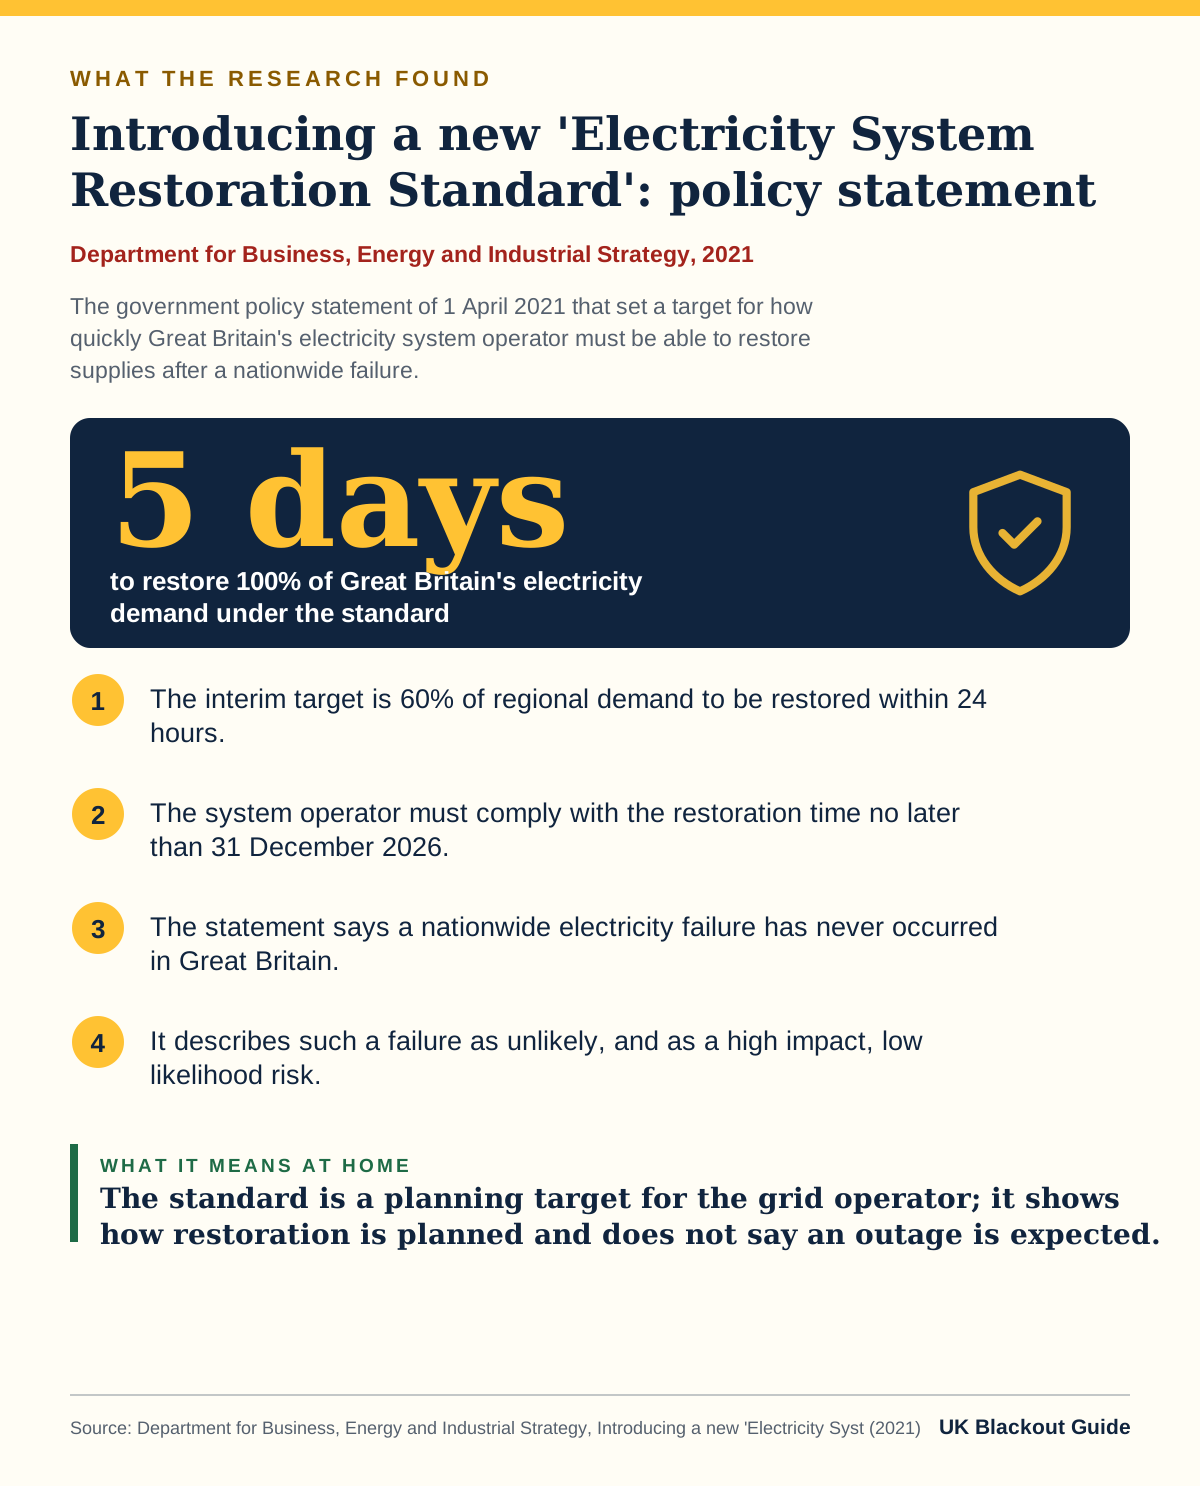
Infographic. Department for Business, Energy and Industrial Strategy, 2021: Introducing a new 'Electricity System Restoration Standard': policy statement. Key figure: 5 days to restore 100% of Great Britain's electricity demand under the standard. Findings: The interim target is 60% of regional demand to be restored within 24 hours. The system operator must comply with the restoration time no later than 31 December 2026. The statement says a nationwide electricity failure has never occurred in Great Britain. It describes such a failure as unlikely, and as a high impact, low likelihood risk.
Introducing a new 'Electricity System Restoration Standard': policy statement, Department for Business, Energy and Industrial Strategy (2021). Read the source · Download this graphic

The government policy statement of 1 April 2021 that set a target for how quickly Great Britain's electricity system operator must be able to restore supplies after a nationwide failure. The standard is a planning target for the grid operator; it shows how restoration is planned and does not say an outage is expected.

The practical side of this evidence is covered in our page on what is a Black Sky event.

National Risk Register 2025
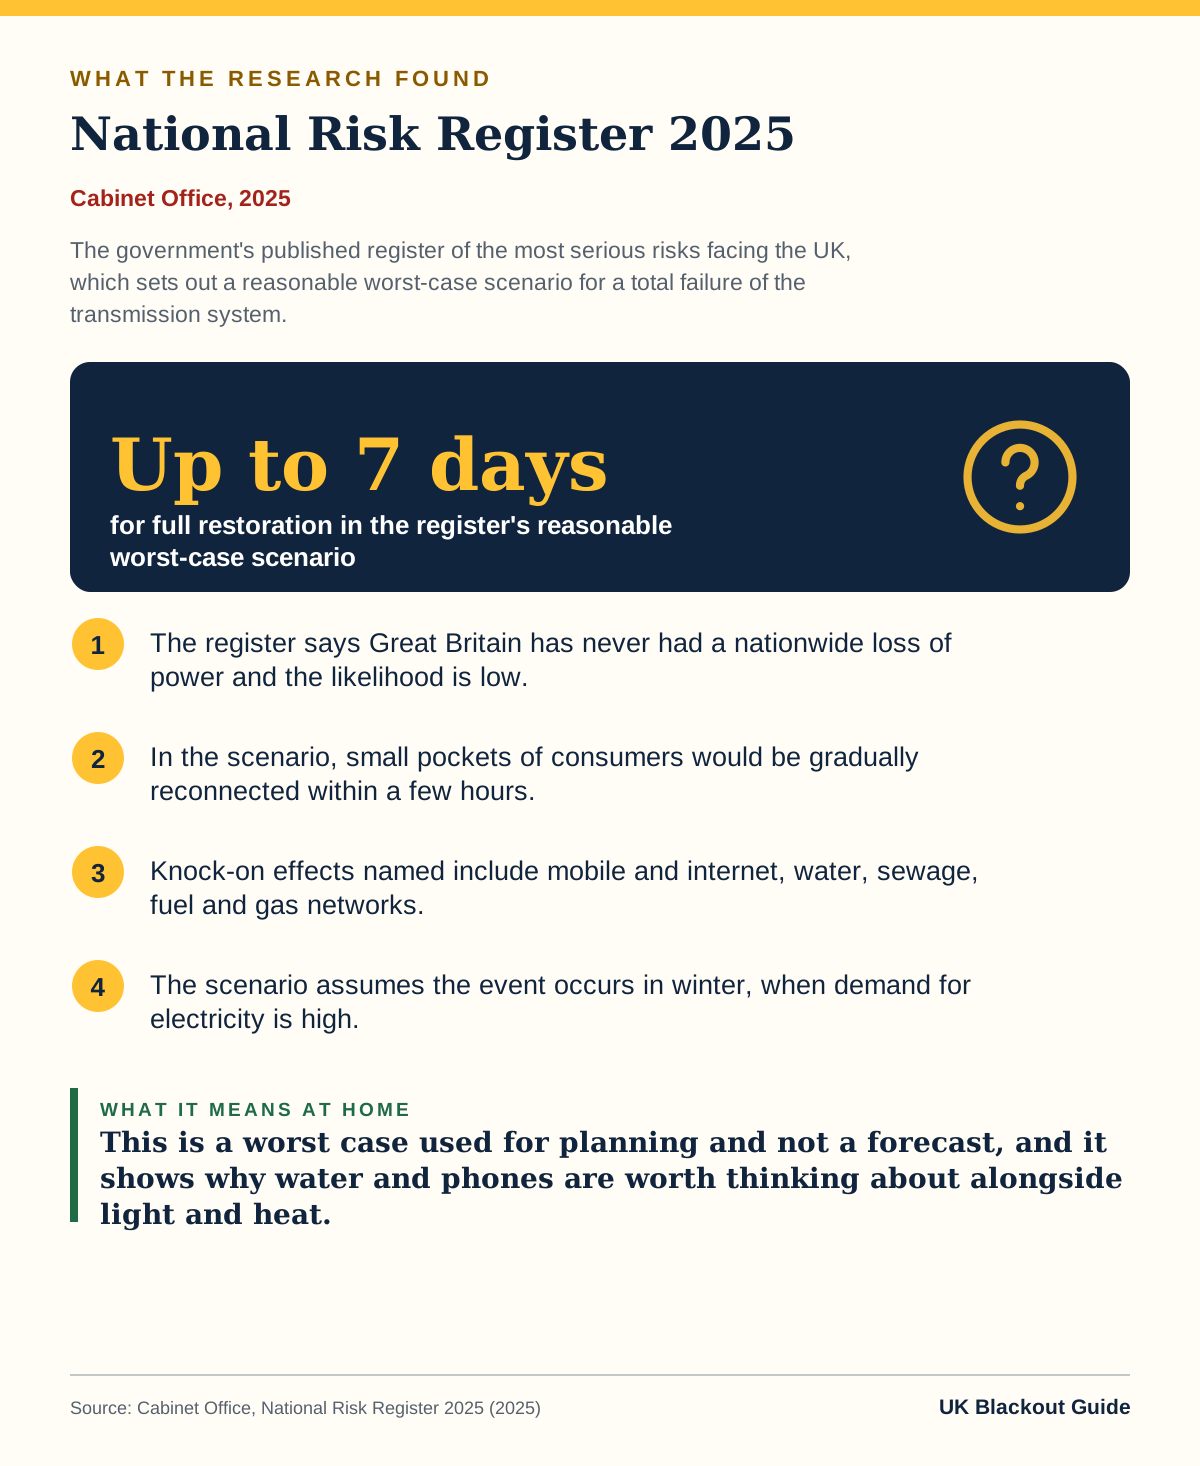
Infographic. Cabinet Office, 2025: National Risk Register 2025. Key figure: Up to 7 days for full restoration in the register's reasonable worst-case scenario. Findings: The register says Great Britain has never had a nationwide loss of power and the likelihood is low. In the scenario, small pockets of consumers would be gradually reconnected within a few hours. Knock-on effects named include mobile and internet, water, sewage, fuel and gas networks. The scenario assumes the event occurs in winter, when demand for electricity is high.
National Risk Register 2025, Cabinet Office (2025). Read the source · Download this graphic

The government's published register of the most serious risks facing the UK, which sets out a reasonable worst-case scenario for a total failure of the transmission system. This is a worst case used for planning and not a forecast, and it shows why water and phones are worth thinking about alongside light and heat.

These figures shape the advice in how long could a UK blackout last.

UK Public Survey of Risk Perception, Resilience and Preparedness 2026: Headline Findings
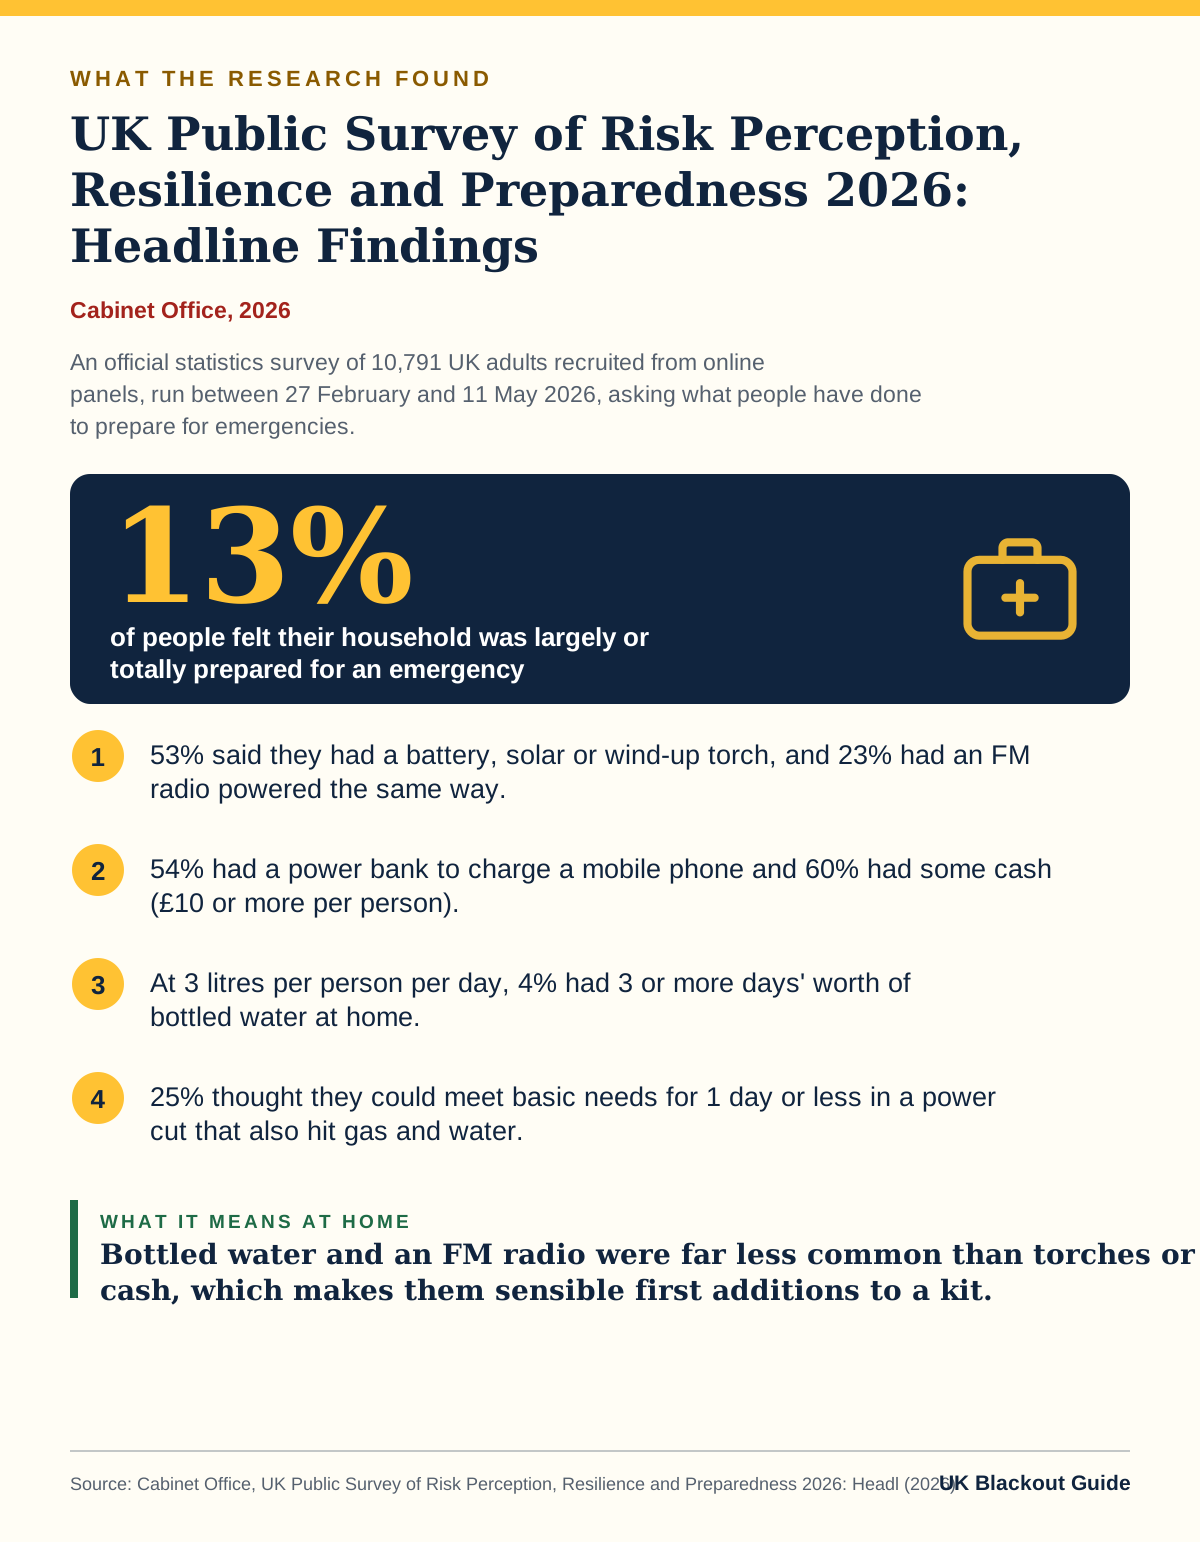
Infographic. Cabinet Office, 2026: UK Public Survey of Risk Perception, Resilience and Preparedness 2026: Headline Findings. Key figure: 13% of people felt their household was largely or totally prepared for an emergency. Findings: 53% said they had a battery, solar or wind-up torch, and 23% had an FM radio powered the same way. 54% had a power bank to charge a mobile phone and 60% had some cash (£10 or more per person). At 3 litres per person per day, 4% had 3 or more days' worth of bottled water at home. 25% thought they could meet basic needs for 1 day or less in a power cut that also hit gas and water.
UK Public Survey of Risk Perception, Resilience and Preparedness 2026: Headline Findings, Cabinet Office (2026). Read the source · Download this graphic

An official statistics survey of 10,791 UK adults recruited from online panels, run between 27 February and 11 May 2026, asking what people have done to prepare for emergencies. Bottled water and an FM radio were far less common than torches or cash, which makes them sensible first additions to a kit.

These figures shape the advice in what do you need in an emergency blackout kit.

Your landline is going digital: what you need to know
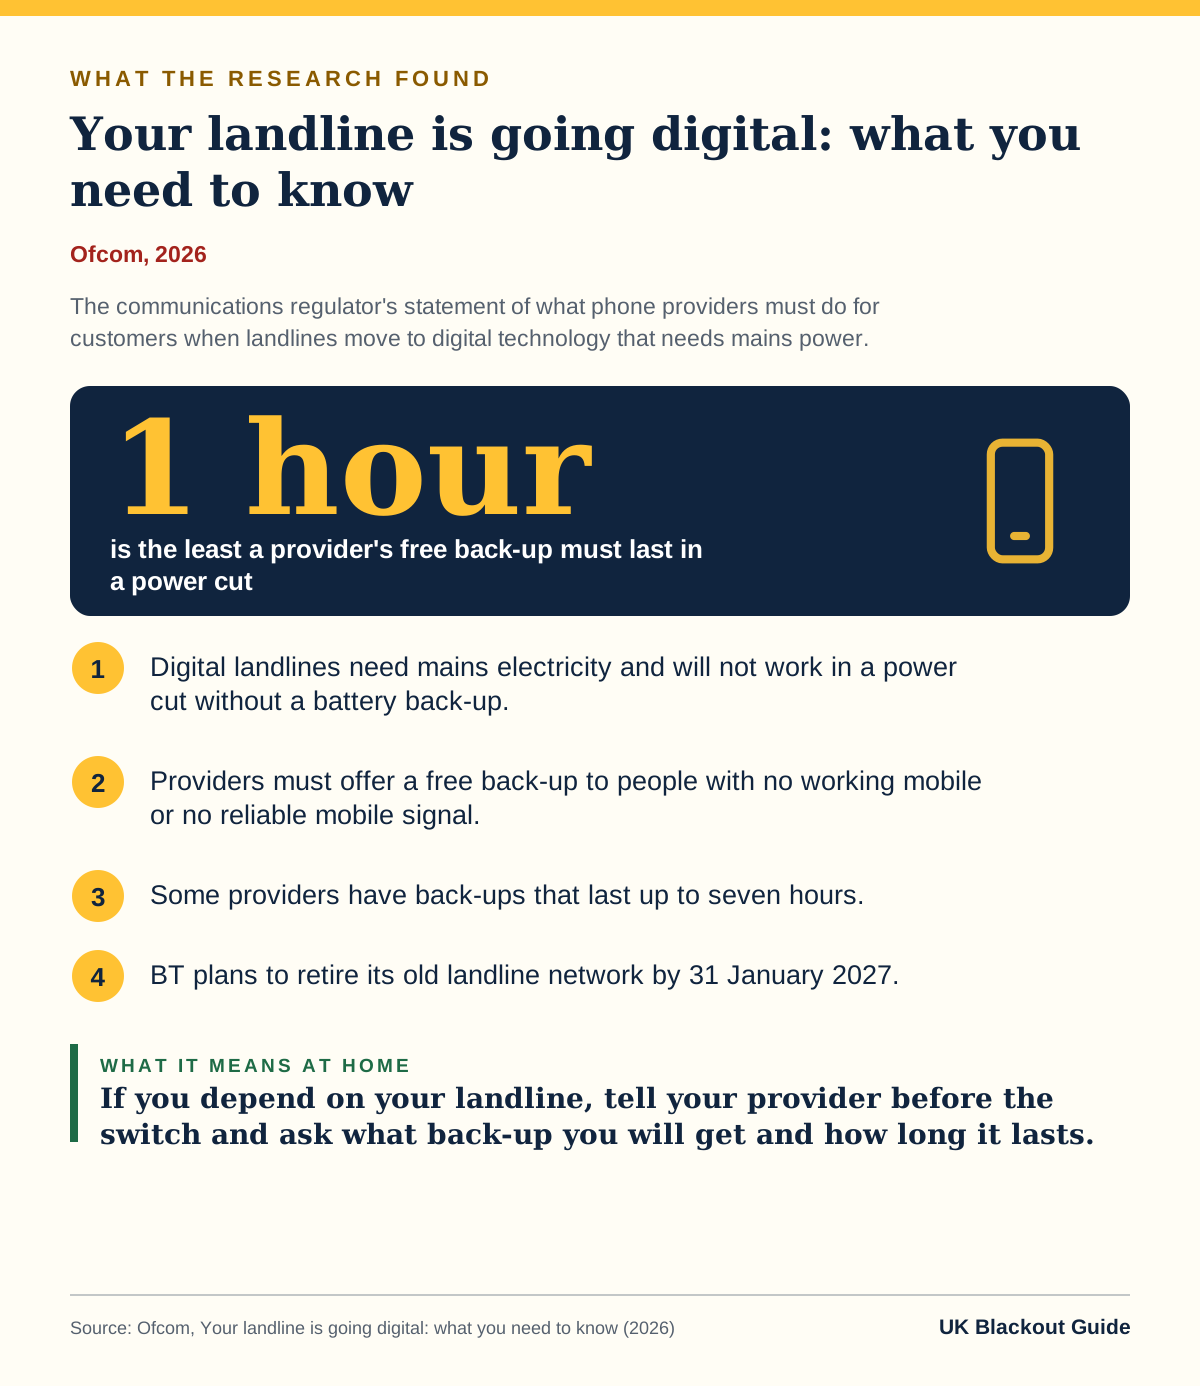
Infographic. Ofcom, 2026: Your landline is going digital: what you need to know. Key figure: 1 hour is the least a provider's free back-up must last in a power cut. Findings: Digital landlines need mains electricity and will not work in a power cut without a battery back-up. Providers must offer a free back-up to people with no working mobile or no reliable mobile signal. Some providers have back-ups that last up to seven hours. BT plans to retire its old landline network by 31 January 2027.
Your landline is going digital: what you need to know, Ofcom (2026). Read the source · Download this graphic

The communications regulator's statement of what phone providers must do for customers when landlines move to digital technology that needs mains power. If you depend on your landline, tell your provider before the switch and ask what back-up you will get and how long it lasts.

We draw on these findings in our guide on do phones work in a power cut, where they sit alongside the practical steps.

Mobile RAN power resilience: Technical Report and CFI Update
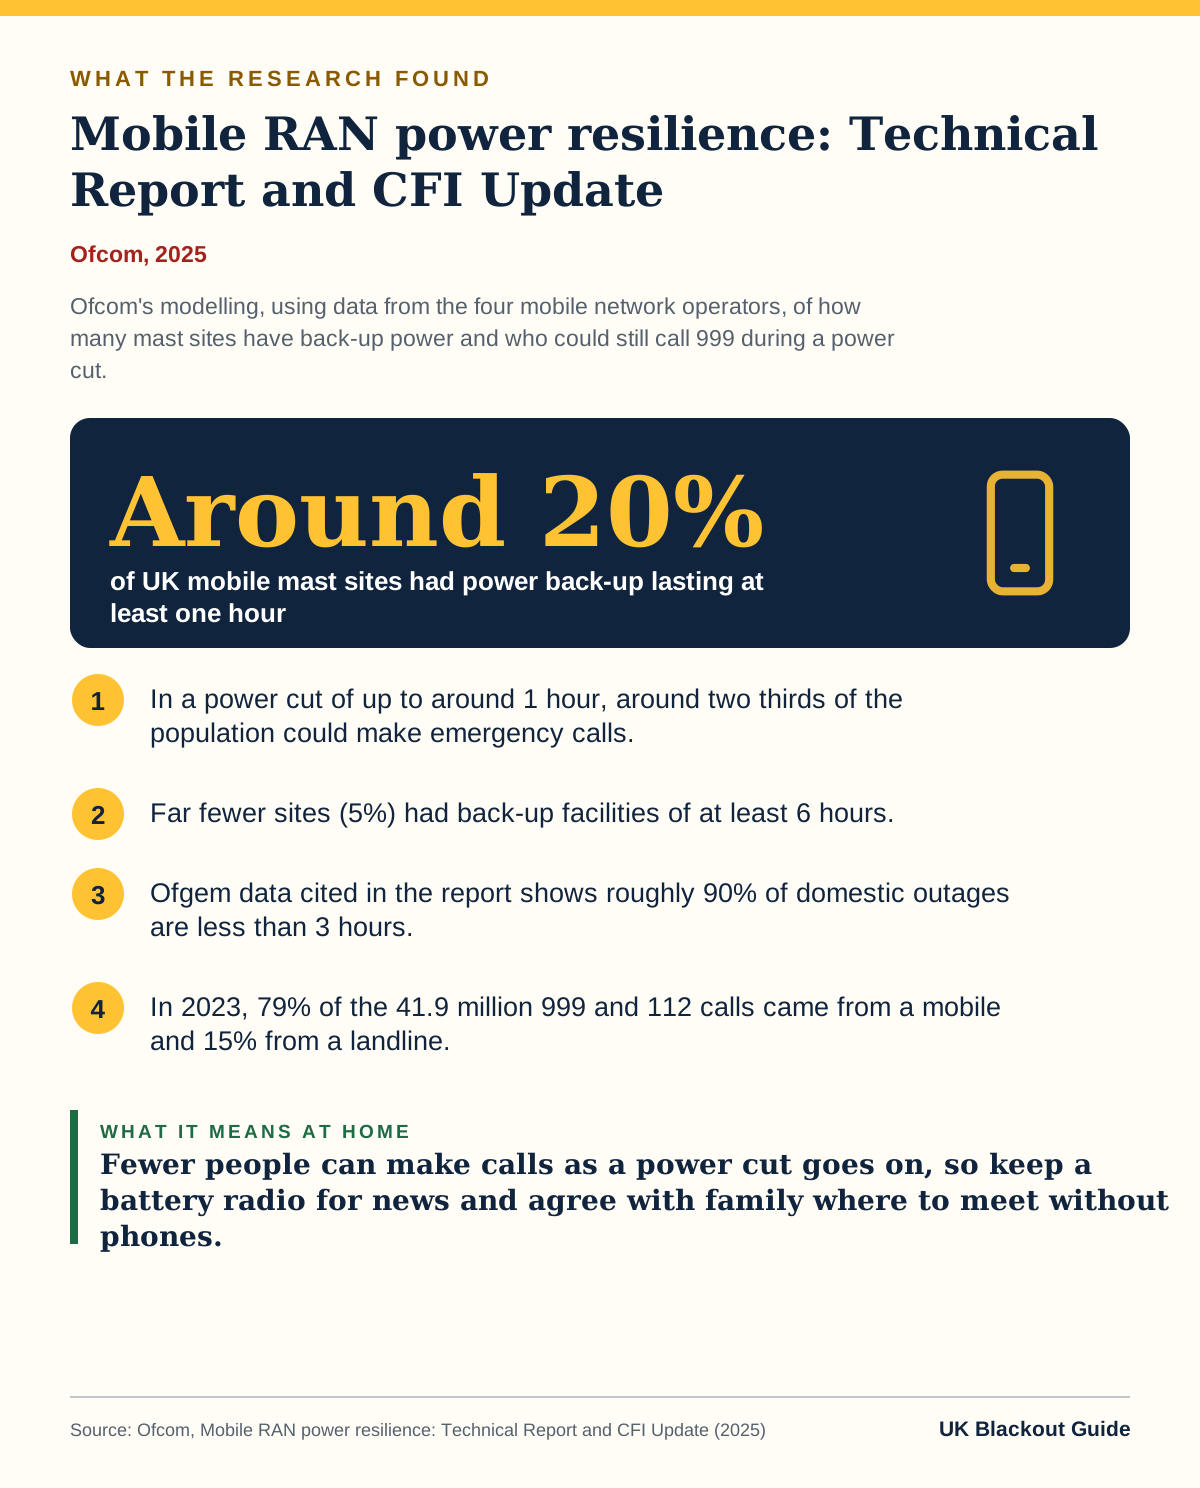
Infographic. Ofcom, 2025: Mobile RAN power resilience: Technical Report and CFI Update. Key figure: Around 20% of UK mobile mast sites had power back-up lasting at least one hour. Findings: In a power cut of up to around 1 hour, around two thirds of the population could make emergency calls. Far fewer sites (5%) had back-up facilities of at least 6 hours. Ofgem data cited in the report shows roughly 90% of domestic outages are less than 3 hours. In 2023, 79% of the 41.9 million 999 and 112 calls came from a mobile and 15% from a landline.
Mobile RAN power resilience: Technical Report and CFI Update, Ofcom (2025). Read the source · Download this graphic

Ofcom's modelling, using data from the four mobile network operators, of how many mast sites have back-up power and who could still call 999 during a power cut. Fewer people can make calls as a power cut goes on, so keep a battery radio for news and agree with family where to meet without phones.

The practical side of this evidence is covered in our page on do phones work in a power cut.

National Energy System Operator publishes final report from the review into the North Hyde Substation outage
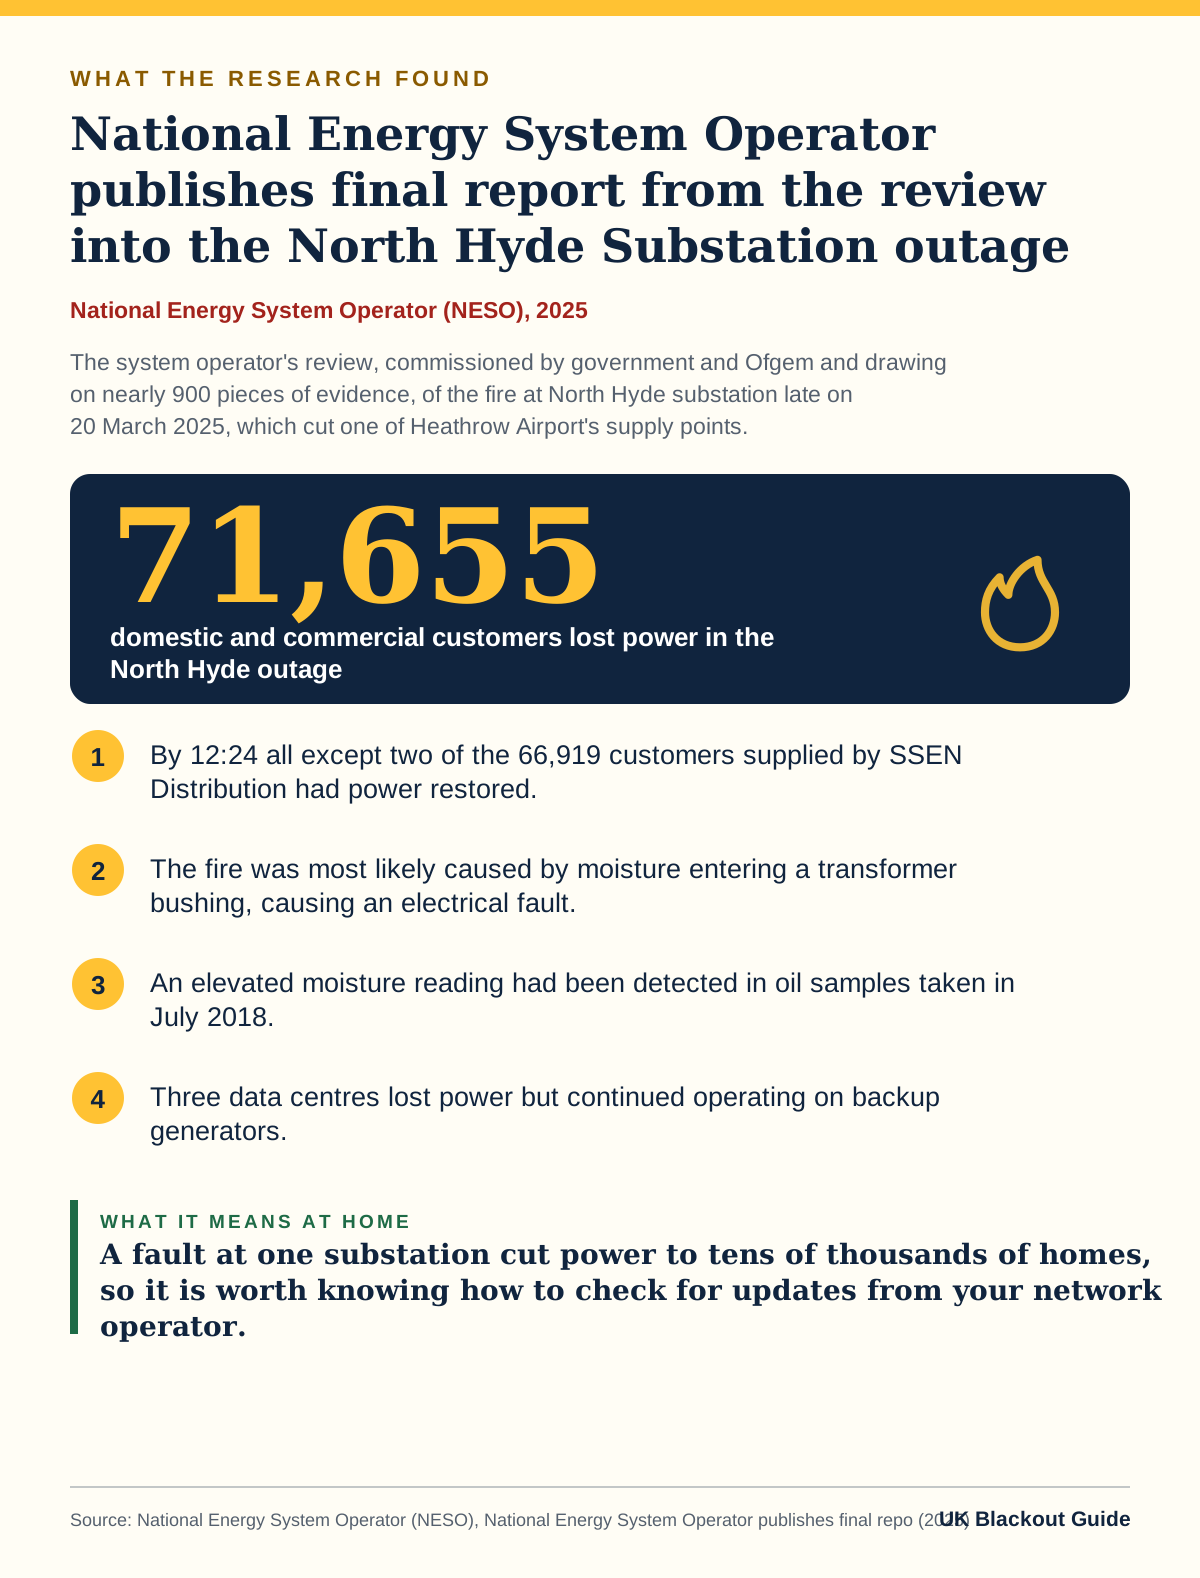
Infographic. National Energy System Operator (NESO), 2025: National Energy System Operator publishes final report from the review into the North Hyde Substation outage. Key figure: 71,655 domestic and commercial customers lost power in the North Hyde outage. Findings: By 12:24 all except two of the 66,919 customers supplied by SSEN Distribution had power restored. The fire was most likely caused by moisture entering a transformer bushing, causing an electrical fault. An elevated moisture reading had been detected in oil samples taken in July 2018. Three data centres lost power but continued operating on backup generators.
National Energy System Operator publishes final report from the review into the North Hyde Substation outage, National Energy System Operator (NESO) (2025). Read the source · Download this graphic

The system operator's review, commissioned by government and Ofgem and drawing on nearly 900 pieces of evidence, of the fire at North Hyde substation late on 20 March 2025, which cut one of Heathrow Airport's supply points. A fault at one substation cut power to tens of thousands of homes, so it is worth knowing how to check for updates from your network operator.

For what to do with this at home, see how we use it in what causes power cuts in the UK.

RIIO-1 Electricity Distribution Summary Annual Report: 2022-23
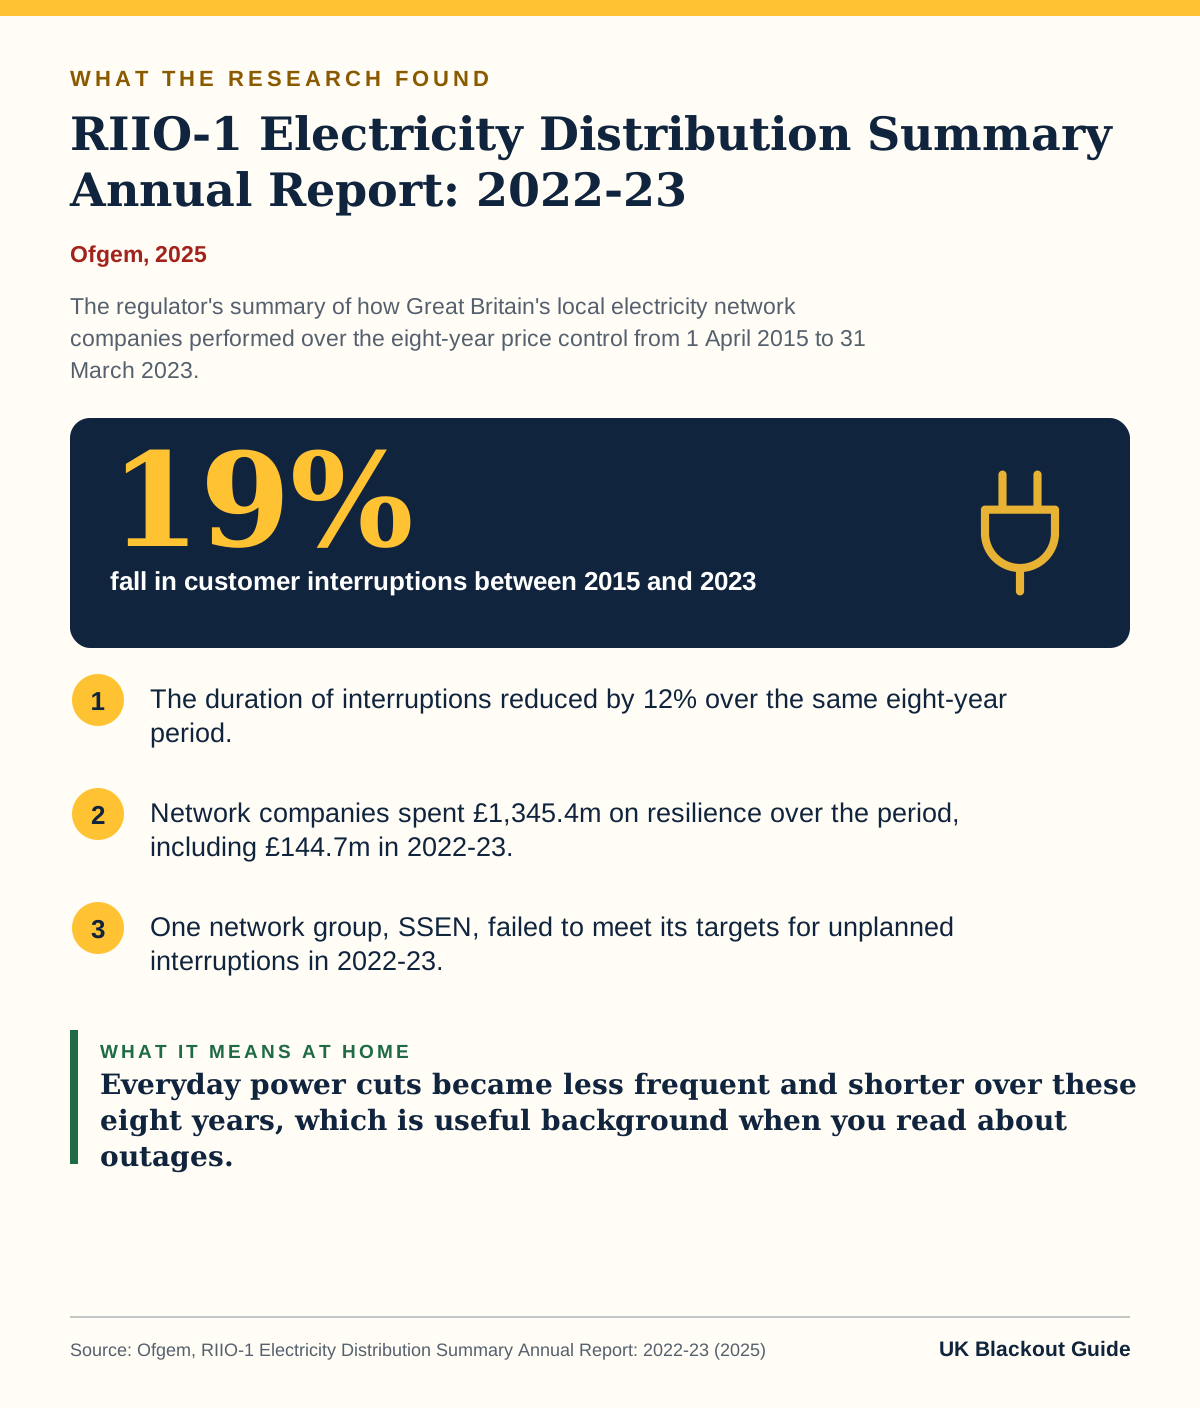
Infographic. Ofgem, 2025: RIIO-1 Electricity Distribution Summary Annual Report: 2022-23. Key figure: 19% fall in customer interruptions between 2015 and 2023. Findings: The duration of interruptions reduced by 12% over the same eight-year period. Network companies spent £1,345.4m on resilience over the period, including £144.7m in 2022-23. One network group, SSEN, failed to meet its targets for unplanned interruptions in 2022-23.
RIIO-1 Electricity Distribution Summary Annual Report: 2022-23, Ofgem (2025). Read the source · Download this graphic

The regulator's summary of how Great Britain's local electricity network companies performed over the eight-year price control from 1 April 2015 to 31 March 2023. Everyday power cuts became less frequent and shorter over these eight years, which is useful background when you read about outages.

For what to do with this at home, see how we use it in what is a blackout.

Accidental poisoning by carbon monoxide, deaths registered in England and Wales: 2024
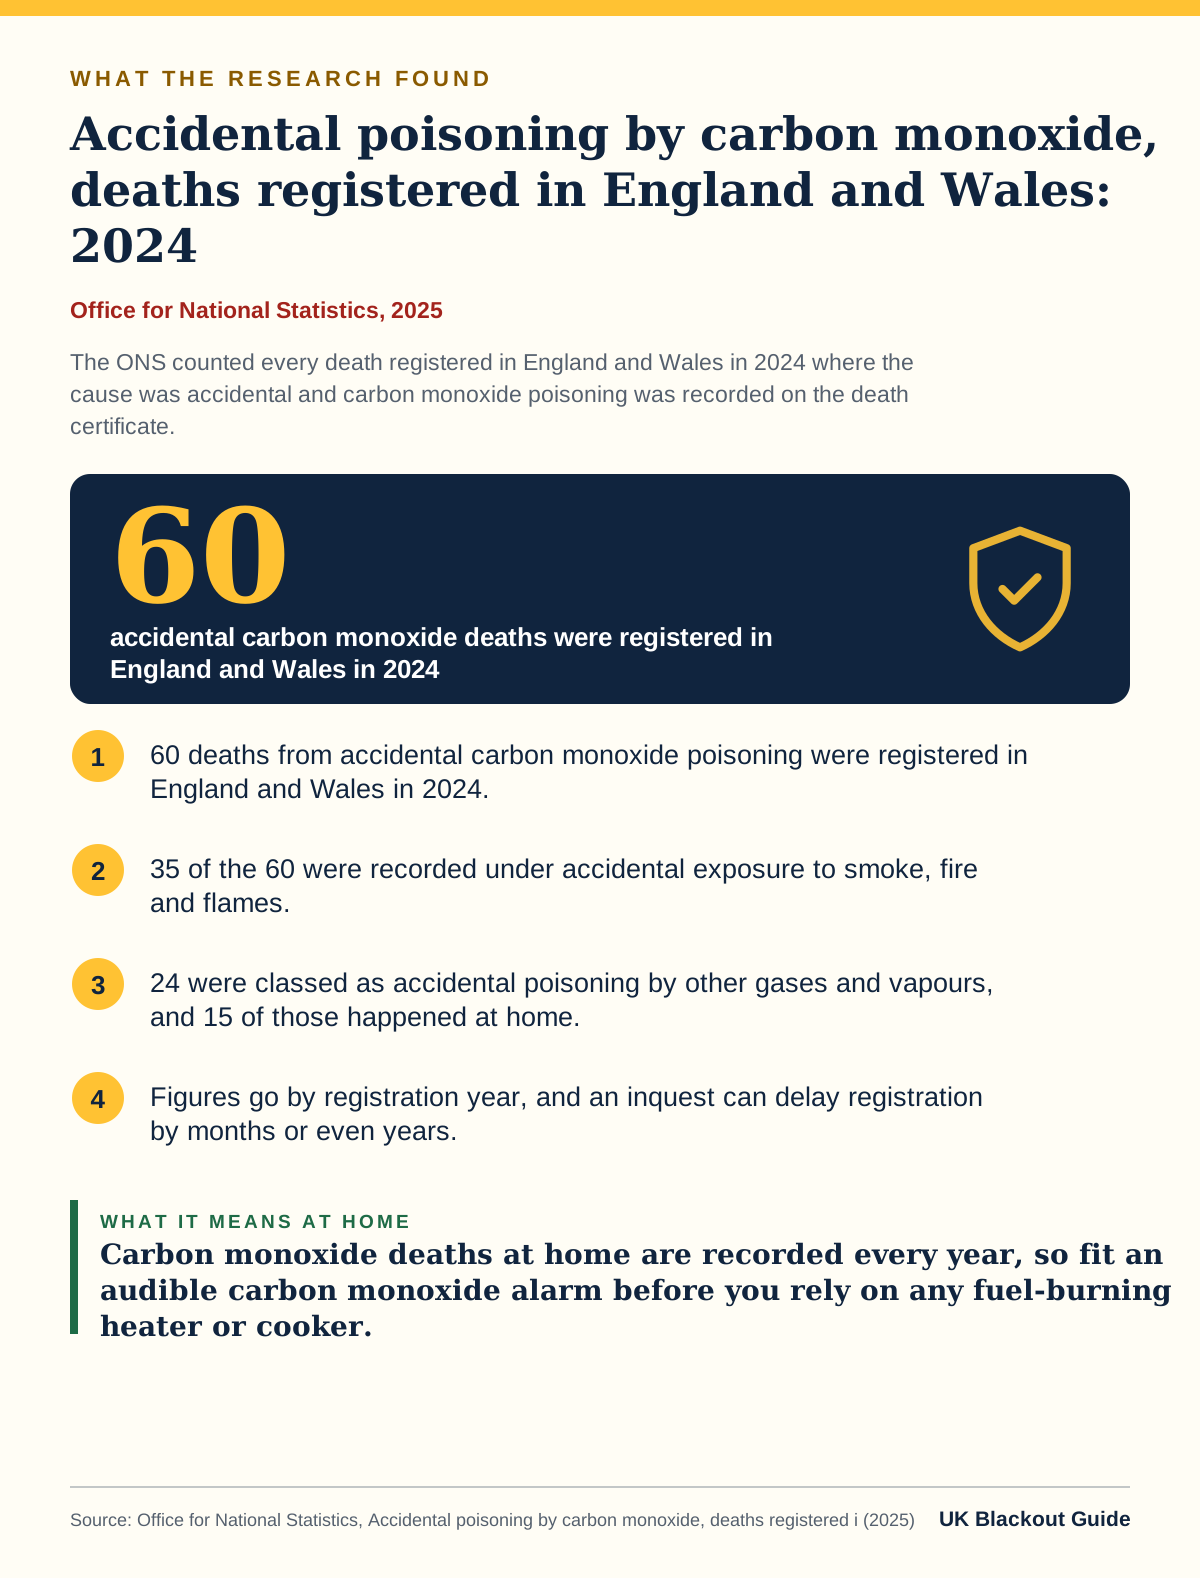
Infographic. Office for National Statistics, 2025: Accidental poisoning by carbon monoxide, deaths registered in England and Wales: 2024. Key figure: 60 accidental carbon monoxide deaths were registered in England and Wales in 2024. Findings: 60 deaths from accidental carbon monoxide poisoning were registered in England and Wales in 2024. 35 of the 60 were recorded under accidental exposure to smoke, fire and flames. 24 were classed as accidental poisoning by other gases and vapours, and 15 of those happened at home. Figures go by registration year, and an inquest can delay registration by months or even years.
Accidental poisoning by carbon monoxide, deaths registered in England and Wales: 2024, Office for National Statistics (2025). Read the source · Download this graphic

The ONS counted every death registered in England and Wales in 2024 where the cause was accidental and carbon monoxide poisoning was recorded on the death certificate. Carbon monoxide deaths at home are recorded every year, so fit an audible carbon monoxide alarm before you rely on any fuel-burning heater or cooker.

For what to do with this at home, see how we use it in can a power cut lead to carbon monoxide poisoning.

Fatal Incidents Associated with Non-Fire Carbon Monoxide Poisoning from Engine-Driven Generators and Other Engine-Driven Tools, 2011-2021
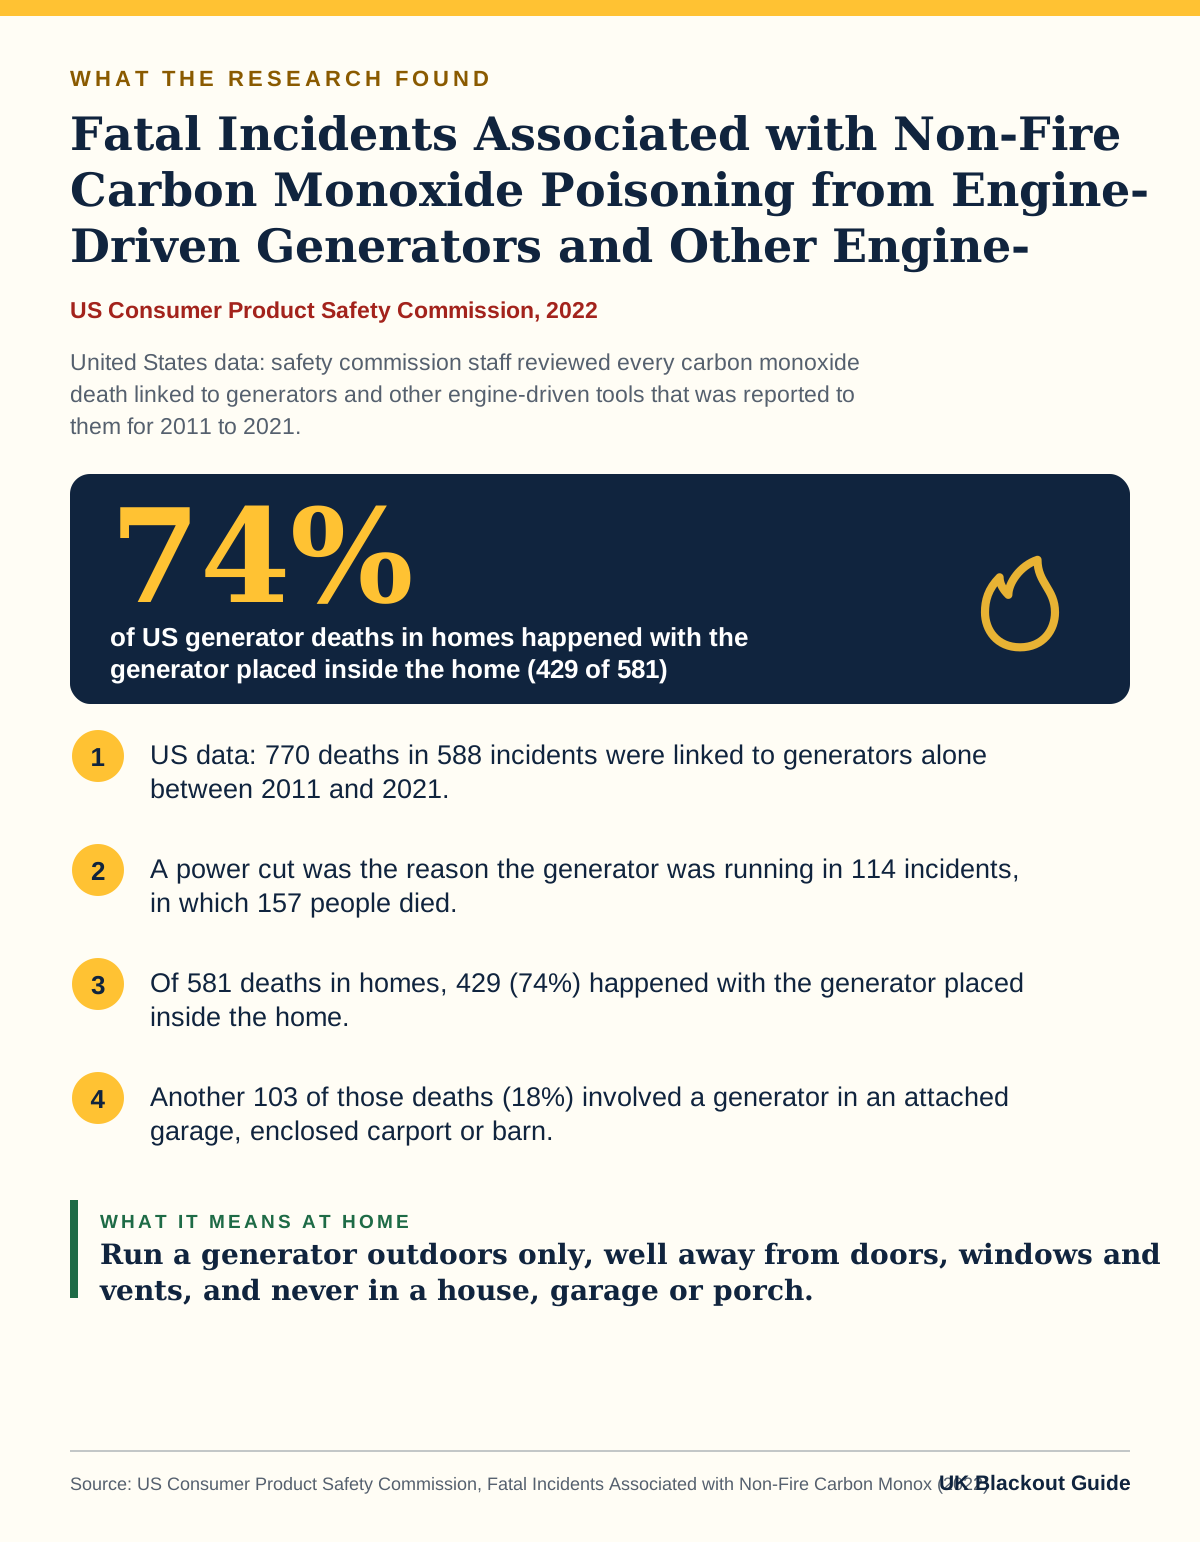
Infographic. US Consumer Product Safety Commission, 2022: Fatal Incidents Associated with Non-Fire Carbon Monoxide Poisoning from Engine-Driven Generators and Other Engine-Driven Tools, 2011-2021. Key figure: 74% of US generator deaths in homes happened with the generator placed inside the home (429 of 581). Findings: US data: 770 deaths in 588 incidents were linked to generators alone between 2011 and 2021. A power cut was the reason the generator was running in 114 incidents, in which 157 people died. Of 581 deaths in homes, 429 (74%) happened with the generator placed inside the home. Another 103 of those deaths (18%) involved a generator in an attached garage, enclosed carport or barn.
Fatal Incidents Associated with Non-Fire Carbon Monoxide Poisoning from Engine-Driven Generators and Other Engine-Driven Tools, 2011-2021, US Consumer Product Safety Commission (2022). Read the source · Download this graphic

United States data: safety commission staff reviewed every carbon monoxide death linked to generators and other engine-driven tools that was reported to them for 2011 to 2021. Run a generator outdoors only, well away from doors, windows and vents, and never in a house, garage or porch.

For what to do with this at home, see how we use it in do you need a generator for a power cut.

Fire statistics table 0602: Primary fires, fatalities and non-fatal casualties by source of ignition, England
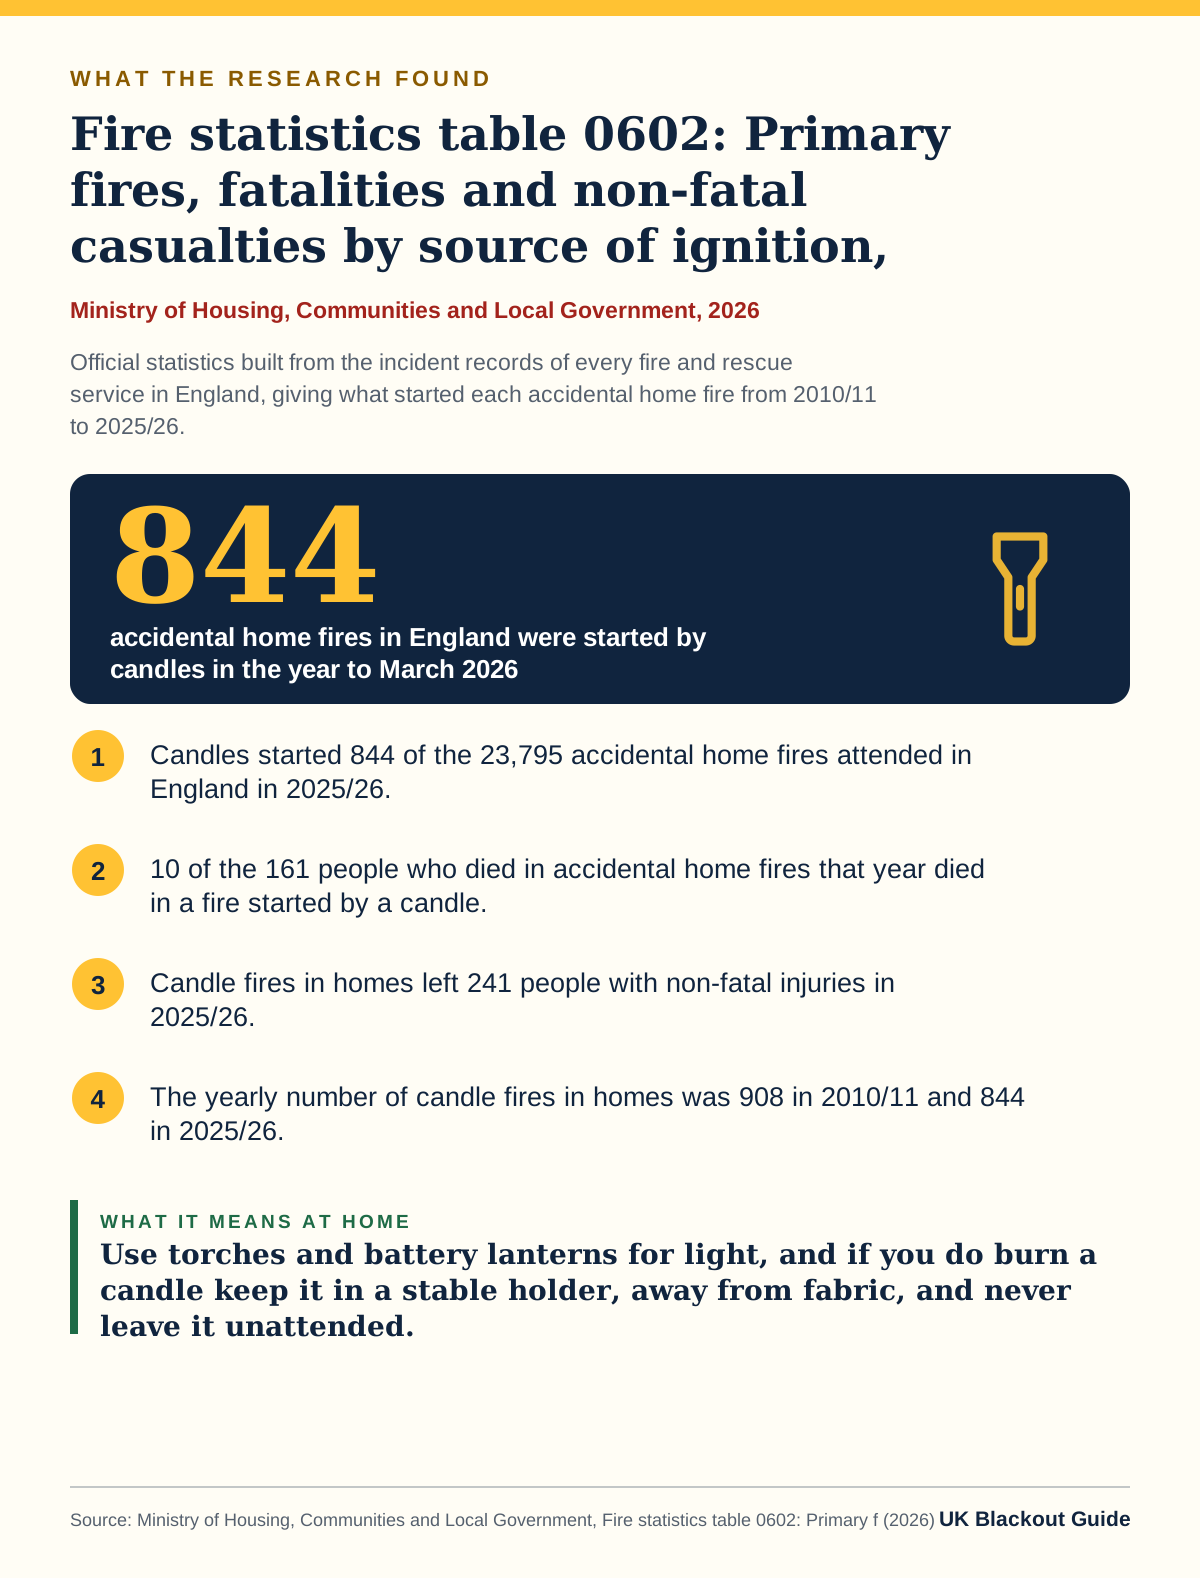
Infographic. Ministry of Housing, Communities and Local Government, 2026: Fire statistics table 0602: Primary fires, fatalities and non-fatal casualties by source of ignition, England. Key figure: 844 accidental home fires in England were started by candles in the year to March 2026. Findings: Candles started 844 of the 23,795 accidental home fires attended in England in 2025/26. 10 of the 161 people who died in accidental home fires that year died in a fire started by a candle. Candle fires in homes left 241 people with non-fatal injuries in 2025/26. The yearly number of candle fires in homes was 908 in 2010/11 and 844 in 2025/26.
Fire statistics table 0602: Primary fires, fatalities and non-fatal casualties by source of ignition, England, Ministry of Housing, Communities and Local Government (2026). Read the source · Download this graphic

Official statistics built from the incident records of every fire and rescue service in England, giving what started each accidental home fire from 2010/11 to 2025/26. Use torches and battery lanterns for light, and if you do burn a candle keep it in a stable holder, away from fabric, and never leave it unattended.

We draw on these findings in our guide on are candles safe in a power cut, where they sit alongside the practical steps.

Detailed analysis of fires attended by fire and rescue services, England, April 2021 to March 2022
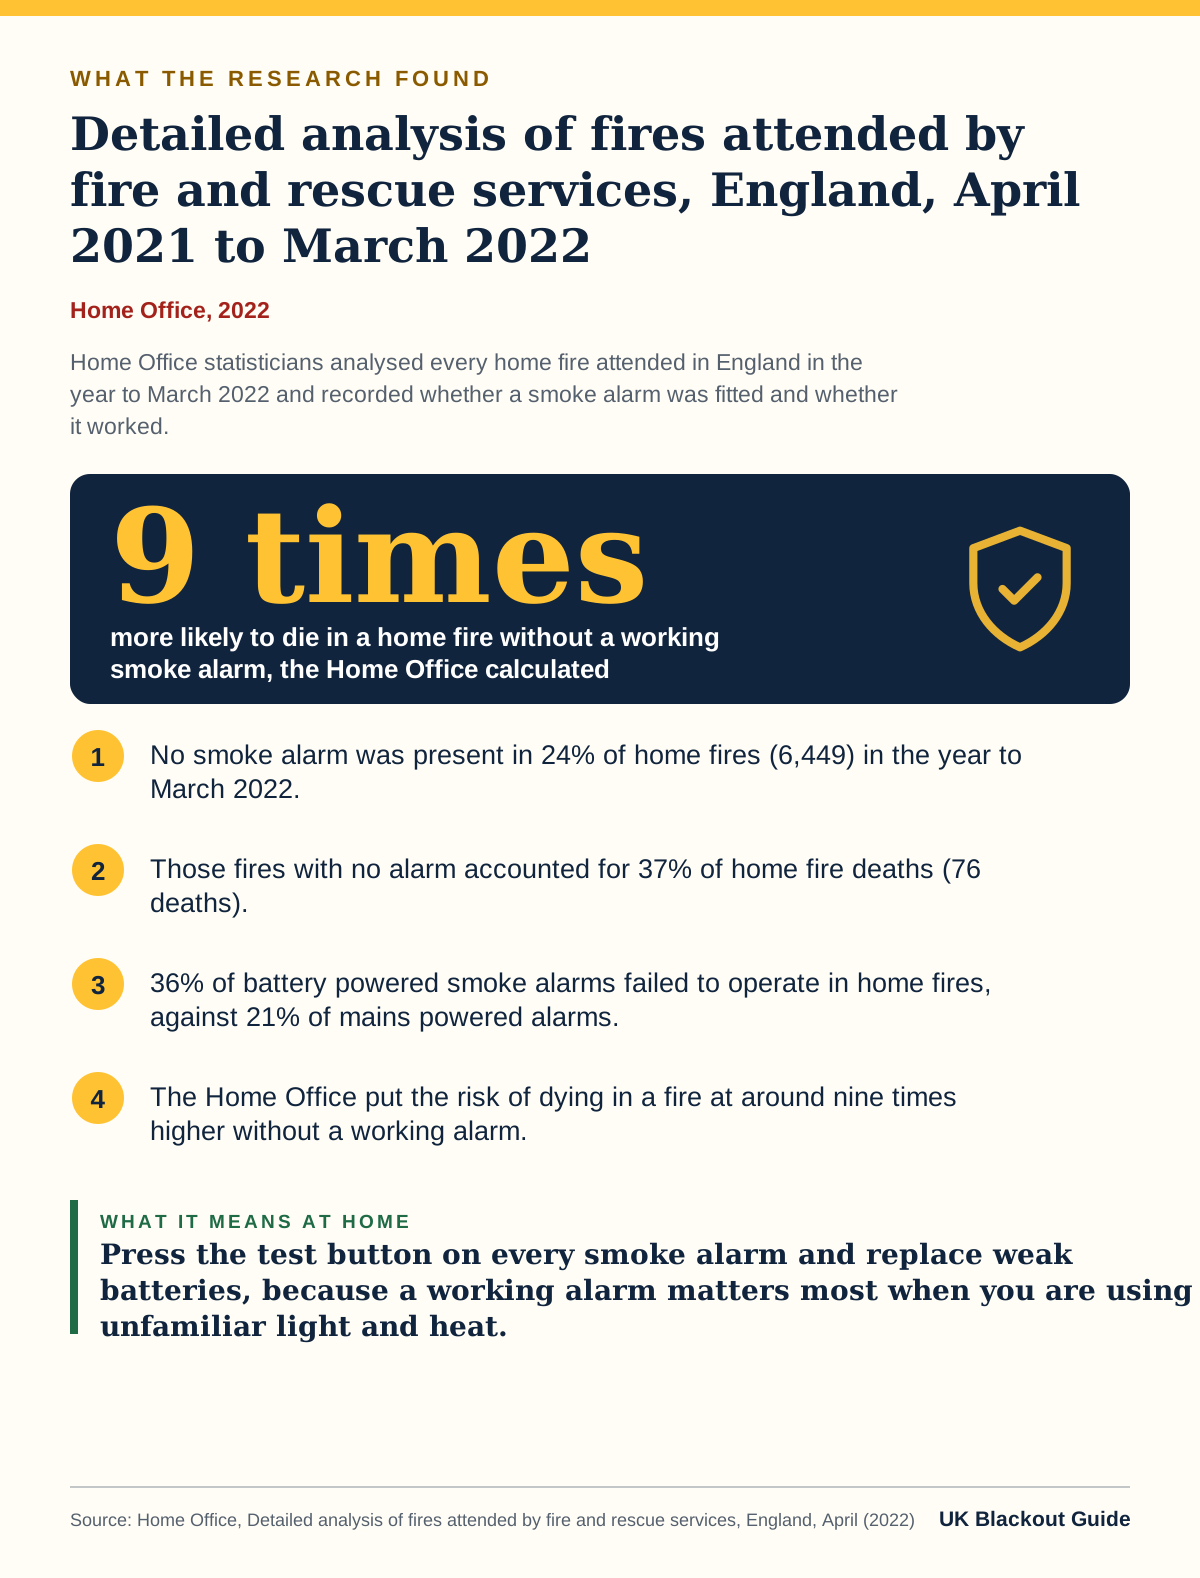
Infographic. Home Office, 2022: Detailed analysis of fires attended by fire and rescue services, England, April 2021 to March 2022. Key figure: 9 times more likely to die in a home fire without a working smoke alarm, the Home Office calculated. Findings: No smoke alarm was present in 24% of home fires (6,449) in the year to March 2022. Those fires with no alarm accounted for 37% of home fire deaths (76 deaths). 36% of battery powered smoke alarms failed to operate in home fires, against 21% of mains powered alarms. The Home Office put the risk of dying in a fire at around nine times higher without a working alarm.
Detailed analysis of fires attended by fire and rescue services, England, April 2021 to March 2022, Home Office (2022). Read the source · Download this graphic

Home Office statisticians analysed every home fire attended in England in the year to March 2022 and recorded whether a smoke alarm was fitted and whether it worked. Press the test button on every smoke alarm and replace weak batteries, because a working alarm matters most when you are using unfamiliar light and heat.

The practical side of this evidence is covered in our page on are candles safe in a power cut.

Minimum home temperature thresholds for health in winter: A systematic literature review
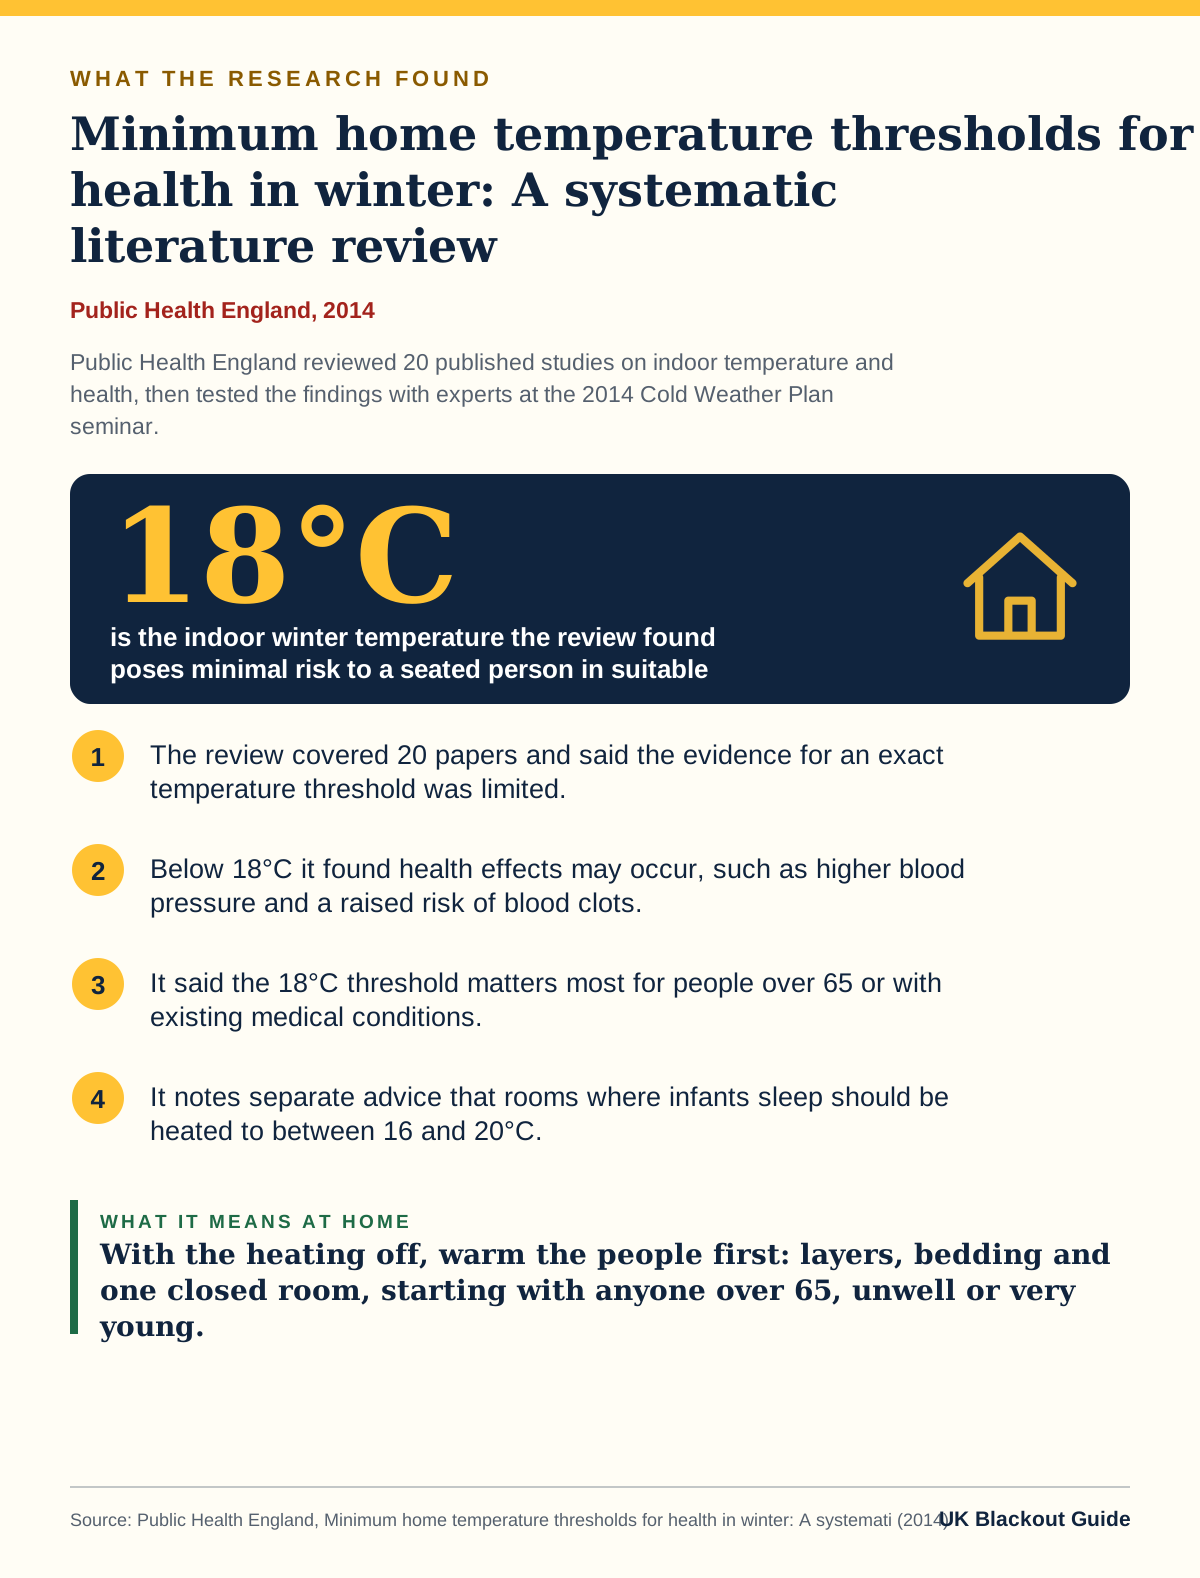
Infographic. Public Health England, 2014: Minimum home temperature thresholds for health in winter: A systematic literature review. Key figure: 18°C is the indoor winter temperature the review found poses minimal risk to a seated person in suitable clothing. Findings: The review covered 20 papers and said the evidence for an exact temperature threshold was limited. Below 18°C it found health effects may occur, such as higher blood pressure and a raised risk of blood clots. It said the 18°C threshold matters most for people over 65 or with existing medical conditions. It notes separate advice that rooms where infants sleep should be heated to between 16 and 20°C.
Minimum home temperature thresholds for health in winter: A systematic literature review, Public Health England (2014). Read the source · Download this graphic

Public Health England reviewed 20 published studies on indoor temperature and health, then tested the findings with experts at the 2014 Cold Weather Plan seminar. With the heating off, warm the people first: layers, bedding and one closed room, starting with anyone over 65, unwell or very young.

These figures shape the advice in how do you keep warm in a power cut.

Winter mortality in England and Wales: 2021 to 2022 (provisional) and 2020 to 2021 (final)
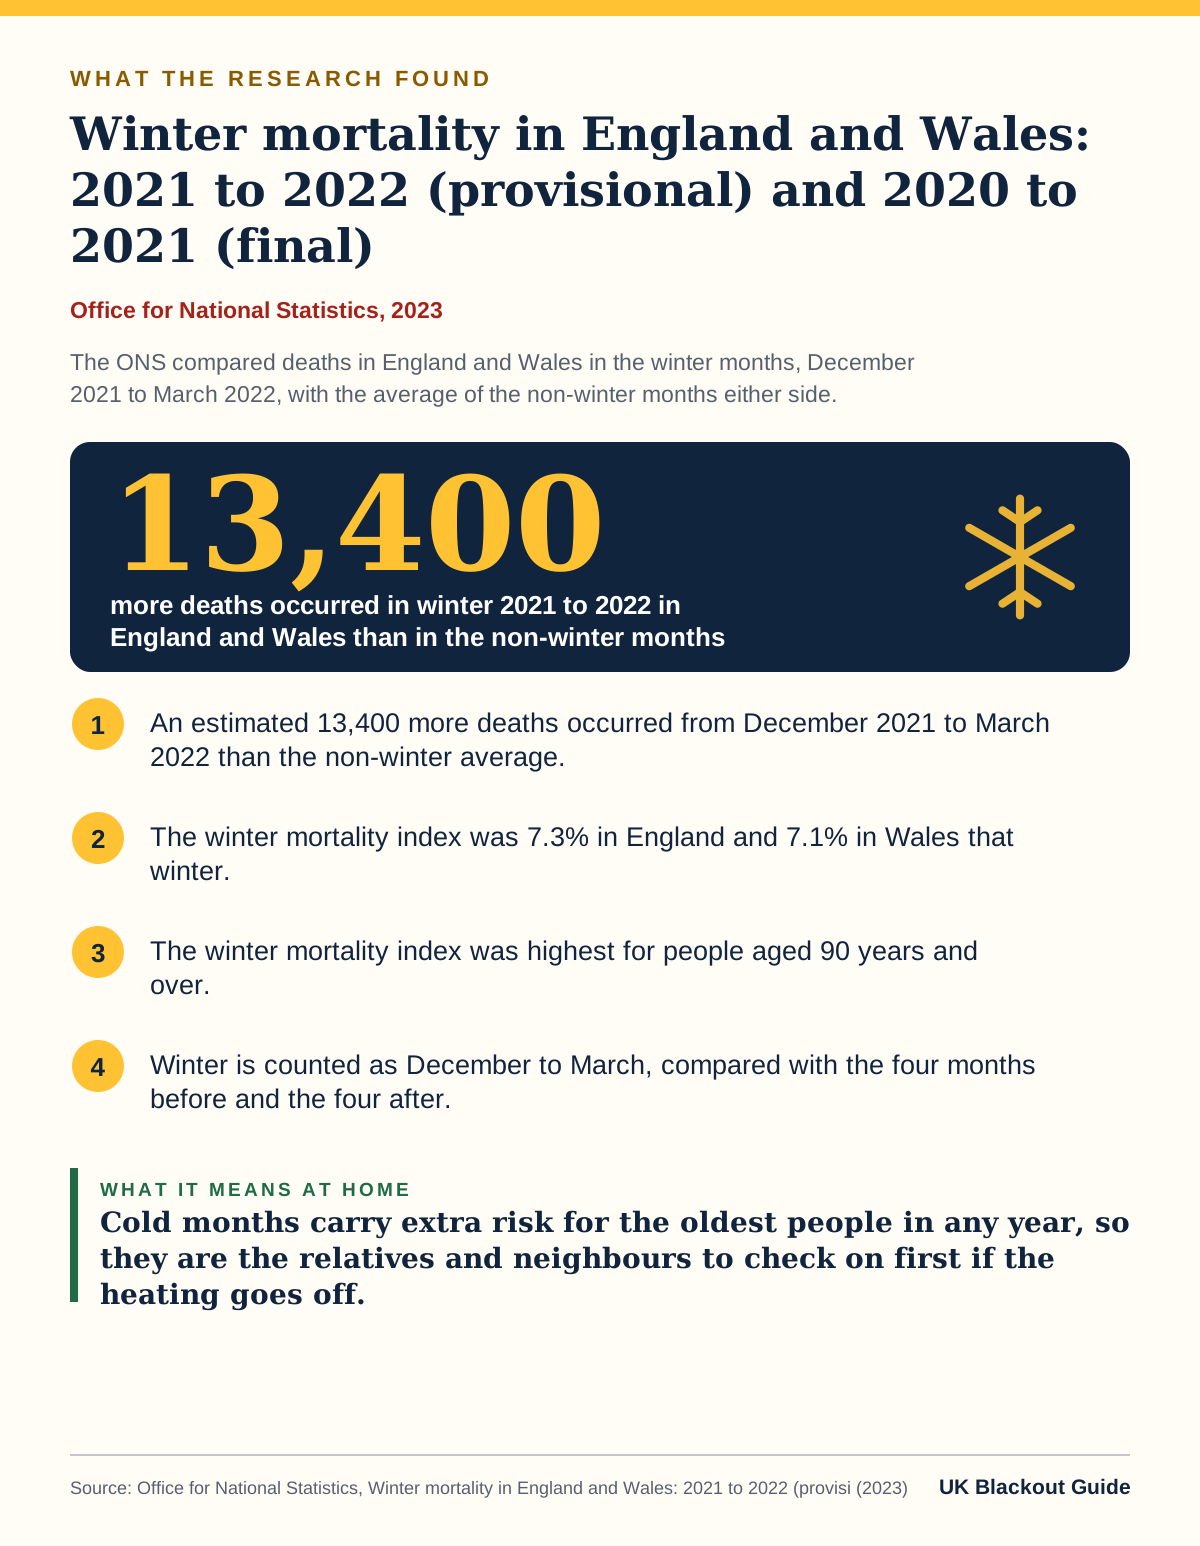
Infographic. Office for National Statistics, 2023: Winter mortality in England and Wales: 2021 to 2022 (provisional) and 2020 to 2021 (final). Key figure: 13,400 more deaths occurred in winter 2021 to 2022 in England and Wales than in the non-winter months. Findings: An estimated 13,400 more deaths occurred from December 2021 to March 2022 than the non-winter average. The winter mortality index was 7.3% in England and 7.1% in Wales that winter. The winter mortality index was highest for people aged 90 years and over. Winter is counted as December to March, compared with the four months before and the four after.
Winter mortality in England and Wales: 2021 to 2022 (provisional) and 2020 to 2021 (final), Office for National Statistics (2023). Read the source · Download this graphic

The ONS compared deaths in England and Wales in the winter months, December 2021 to March 2022, with the average of the non-winter months either side. Cold months carry extra risk for the oldest people in any year, so they are the relatives and neighbours to check on first if the heating goes off.

These figures shape the advice in how do you help older relatives in a power cut.

Mobile RAN power resilience: Technical Report and CFI Update
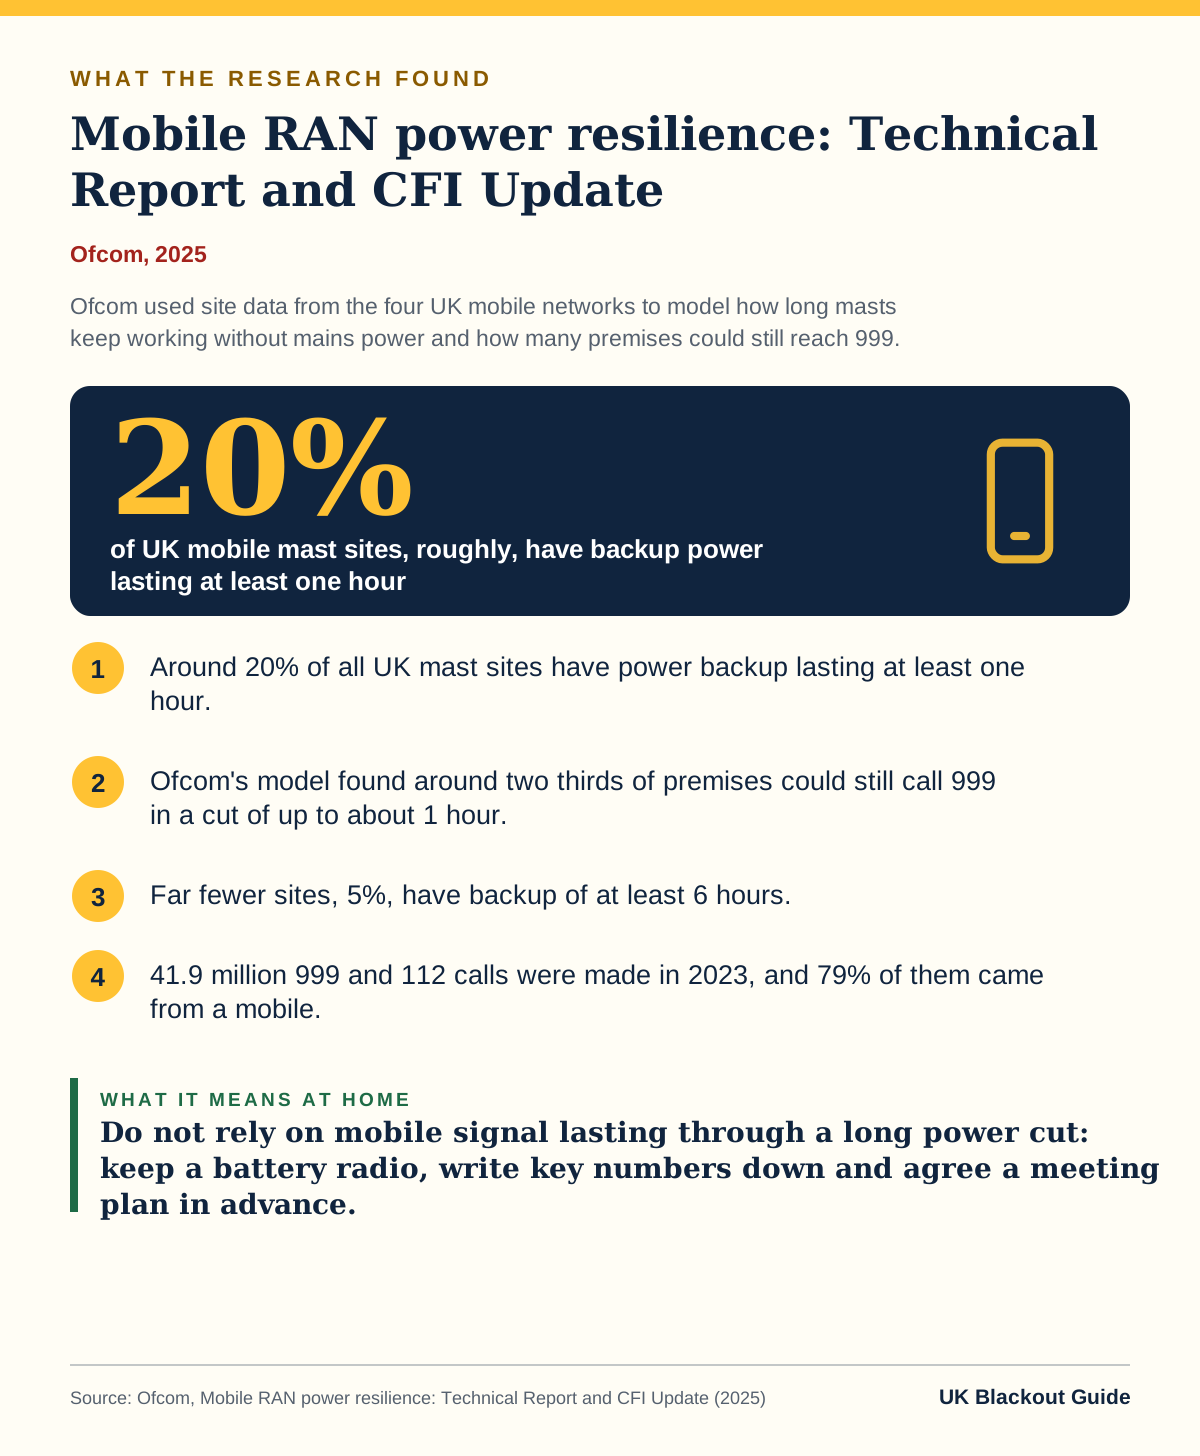
Infographic. Ofcom, 2025: Mobile RAN power resilience: Technical Report and CFI Update. Key figure: 20% of UK mobile mast sites, roughly, have backup power lasting at least one hour. Findings: Around 20% of all UK mast sites have power backup lasting at least one hour. Ofcom's model found around two thirds of premises could still call 999 in a cut of up to about 1 hour. Far fewer sites, 5%, have backup of at least 6 hours. 41.9 million 999 and 112 calls were made in 2023, and 79% of them came from a mobile.
Mobile RAN power resilience: Technical Report and CFI Update, Ofcom (2025). Read the source · Download this graphic

Ofcom used site data from the four UK mobile networks to model how long masts keep working without mains power and how many premises could still reach 999. Do not rely on mobile signal lasting through a long power cut: keep a battery radio, write key numbers down and agree a meeting plan in advance.

We draw on these findings in our guide on do phones work in a power cut, where they sit alongside the practical steps.

Energy Emergencies Executive Committee Storm Arwen Review: Final Report
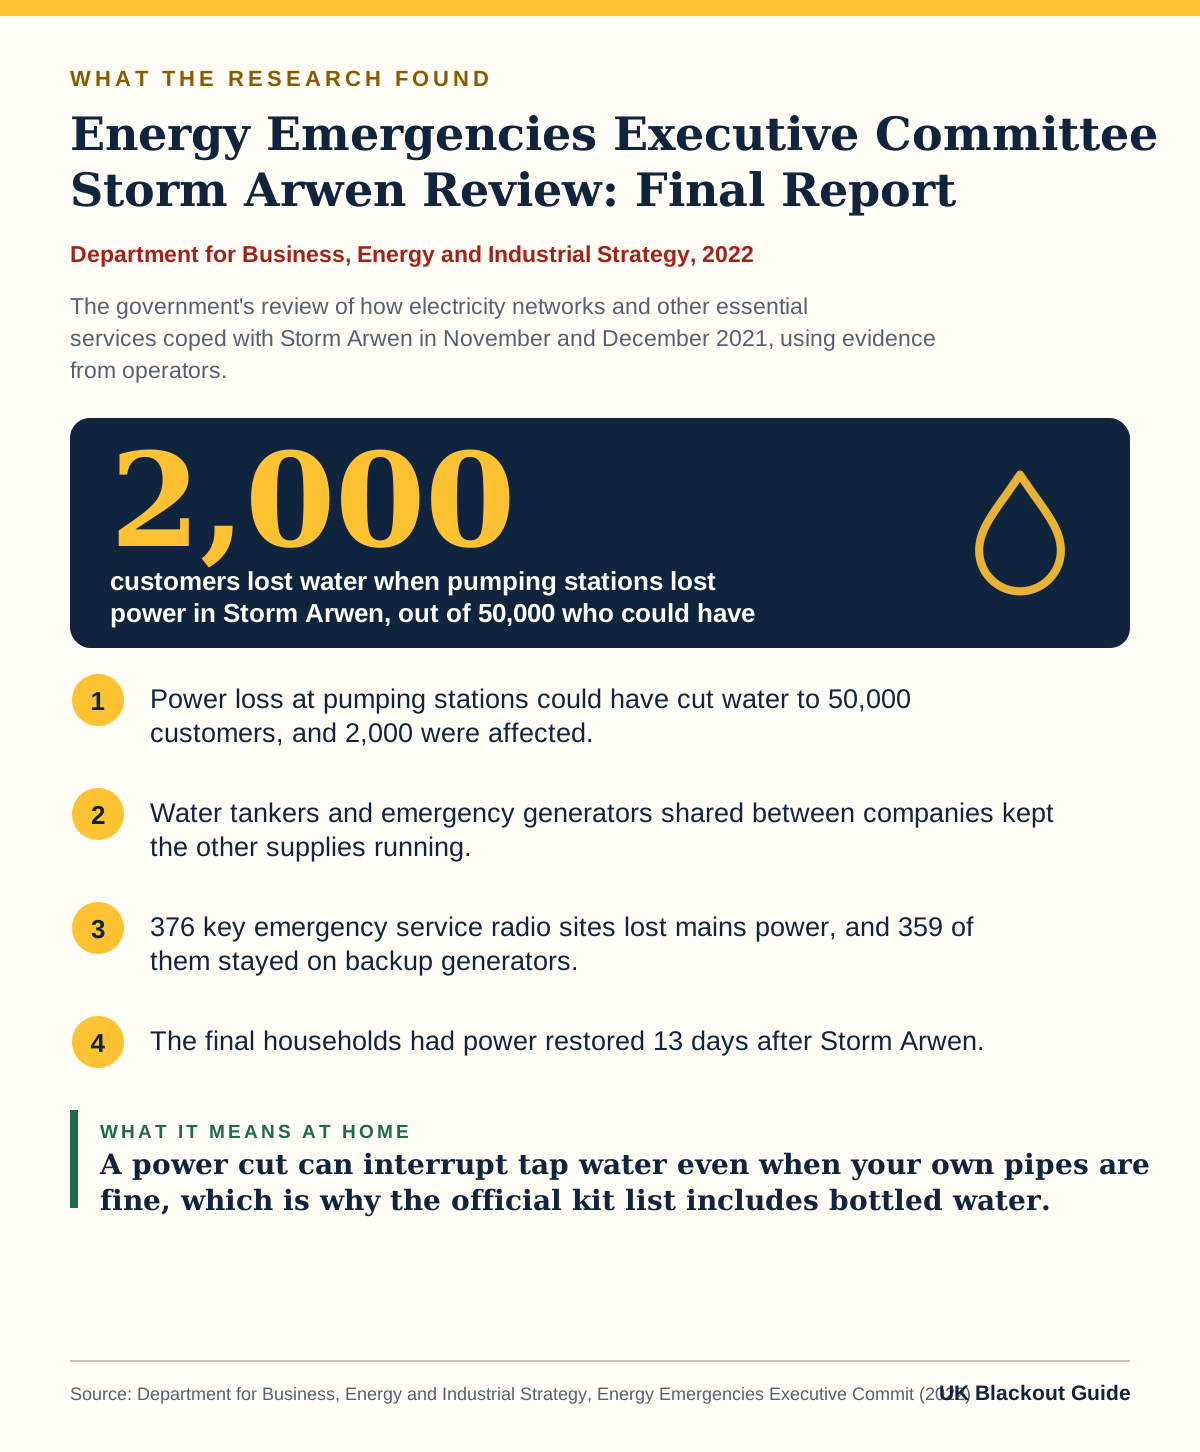
Infographic. Department for Business, Energy and Industrial Strategy, 2022: Energy Emergencies Executive Committee Storm Arwen Review: Final Report. Key figure: 2,000 customers lost water when pumping stations lost power in Storm Arwen, out of 50,000 who could have. Findings: Power loss at pumping stations could have cut water to 50,000 customers, and 2,000 were affected. Water tankers and emergency generators shared between companies kept the other supplies running. 376 key emergency service radio sites lost mains power, and 359 of them stayed on backup generators. The final households had power restored 13 days after Storm Arwen.
Energy Emergencies Executive Committee Storm Arwen Review: Final Report, Department for Business, Energy and Industrial Strategy (2022). Read the source · Download this graphic

The government's review of how electricity networks and other essential services coped with Storm Arwen in November and December 2021, using evidence from operators. A power cut can interrupt tap water even when your own pipes are fine, which is why the official kit list includes bottled water.

We draw on these findings in our guide on how much water should you store for a power cut, where they sit alongside the practical steps.

FROST: Fridge Recording Over Set Time. A citizen science project
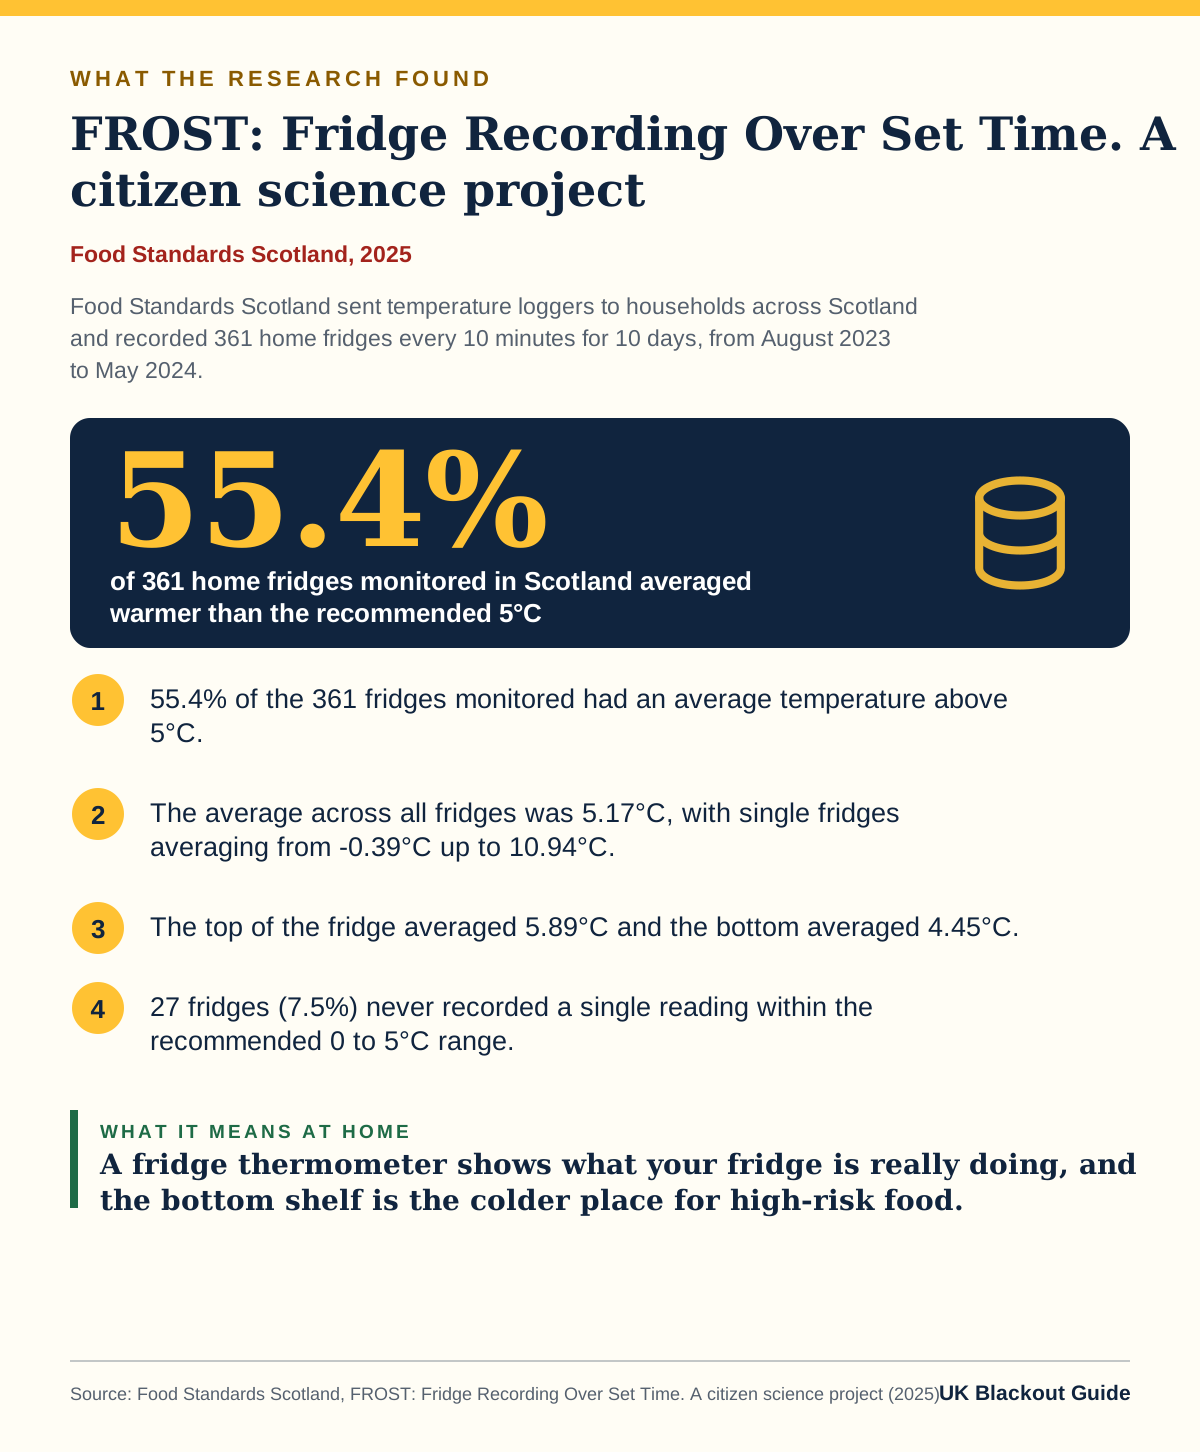
Infographic. Food Standards Scotland, 2025: FROST: Fridge Recording Over Set Time. A citizen science project. Key figure: 55.4% of 361 home fridges monitored in Scotland averaged warmer than the recommended 5°C. Findings: 55.4% of the 361 fridges monitored had an average temperature above 5°C. The average across all fridges was 5.17°C, with single fridges averaging from -0.39°C up to 10.94°C. The top of the fridge averaged 5.89°C and the bottom averaged 4.45°C. 27 fridges (7.5%) never recorded a single reading within the recommended 0 to 5°C range.
FROST: Fridge Recording Over Set Time. A citizen science project, Food Standards Scotland (2025). Read the source · Download this graphic

Food Standards Scotland sent temperature loggers to households across Scotland and recorded 361 home fridges every 10 minutes for 10 days, from August 2023 to May 2024. A fridge thermometer shows what your fridge is really doing, and the bottom shelf is the colder place for high-risk food.

These figures shape the advice in how long does food last in a fridge or freezer in a power cut.

UK Payment Markets 2026: Summary
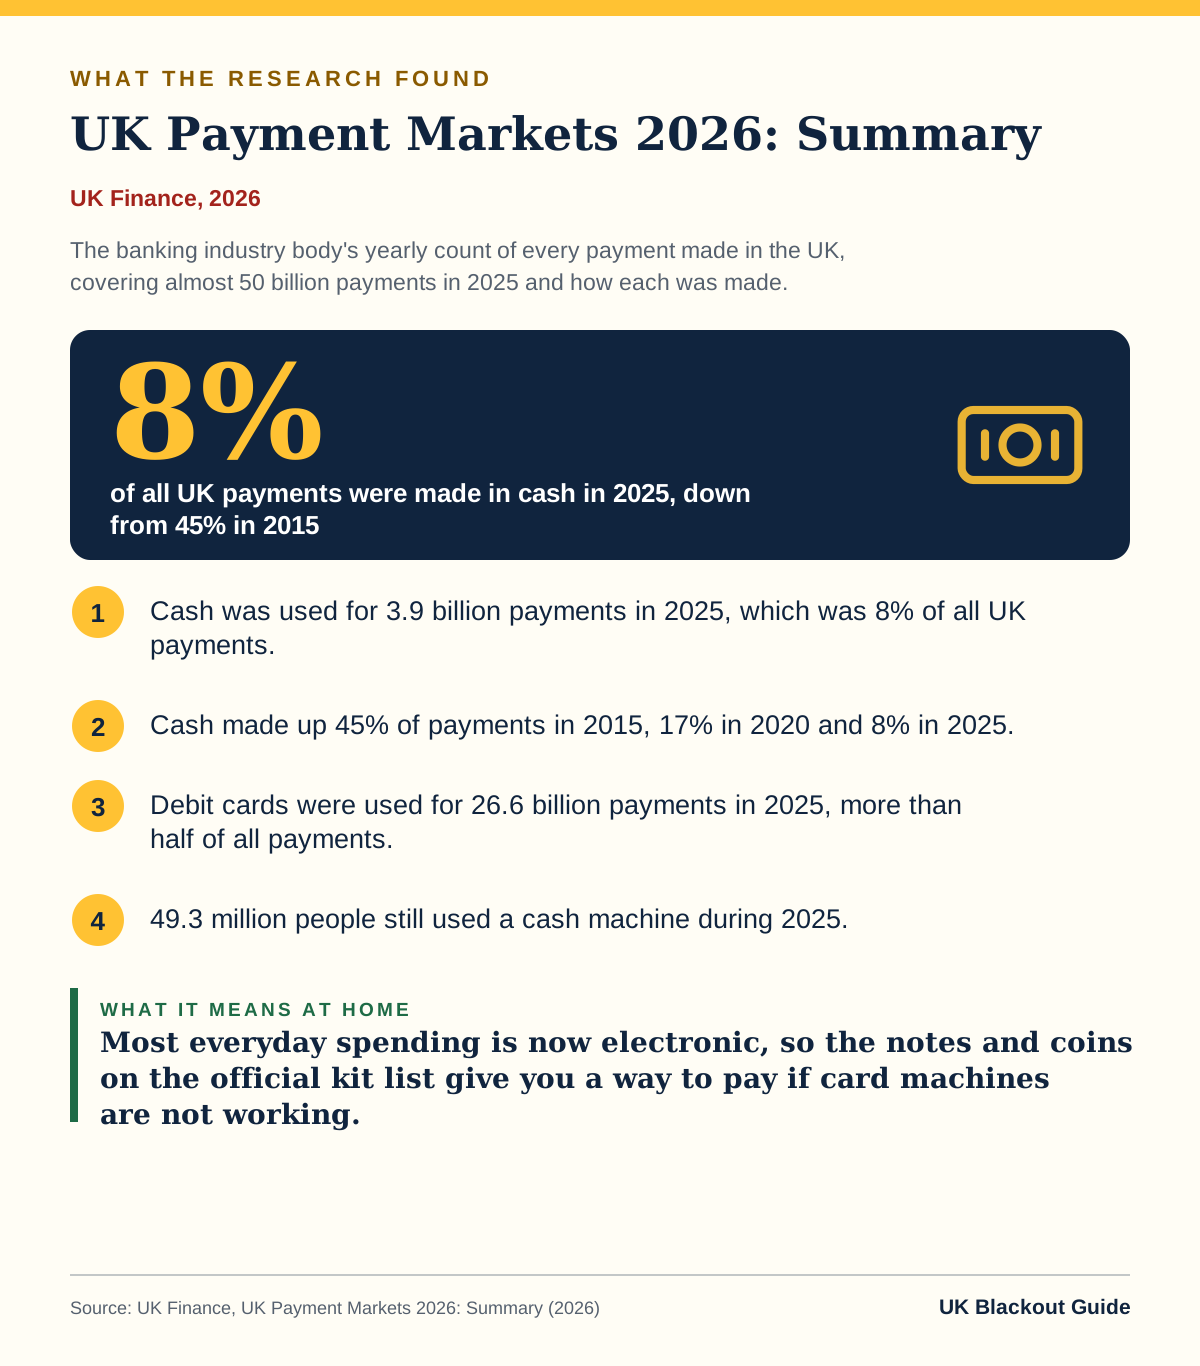
Infographic. UK Finance, 2026: UK Payment Markets 2026: Summary. Key figure: 8% of all UK payments were made in cash in 2025, down from 45% in 2015. Findings: Cash was used for 3.9 billion payments in 2025, which was 8% of all UK payments. Cash made up 45% of payments in 2015, 17% in 2020 and 8% in 2025. Debit cards were used for 26.6 billion payments in 2025, more than half of all payments. 49.3 million people still used a cash machine during 2025.
UK Payment Markets 2026: Summary, UK Finance (2026). Read the source · Download this graphic

The banking industry body's yearly count of every payment made in the UK, covering almost 50 billion payments in 2025 and how each was made. Most everyday spending is now electronic, so the notes and coins on the official kit list give you a way to pay if card machines are not working.

For what to do with this at home, see how we use it in how much cash should you keep for a power cut.

Regulating water, energy and broadband to protect consumers in vulnerable circumstances
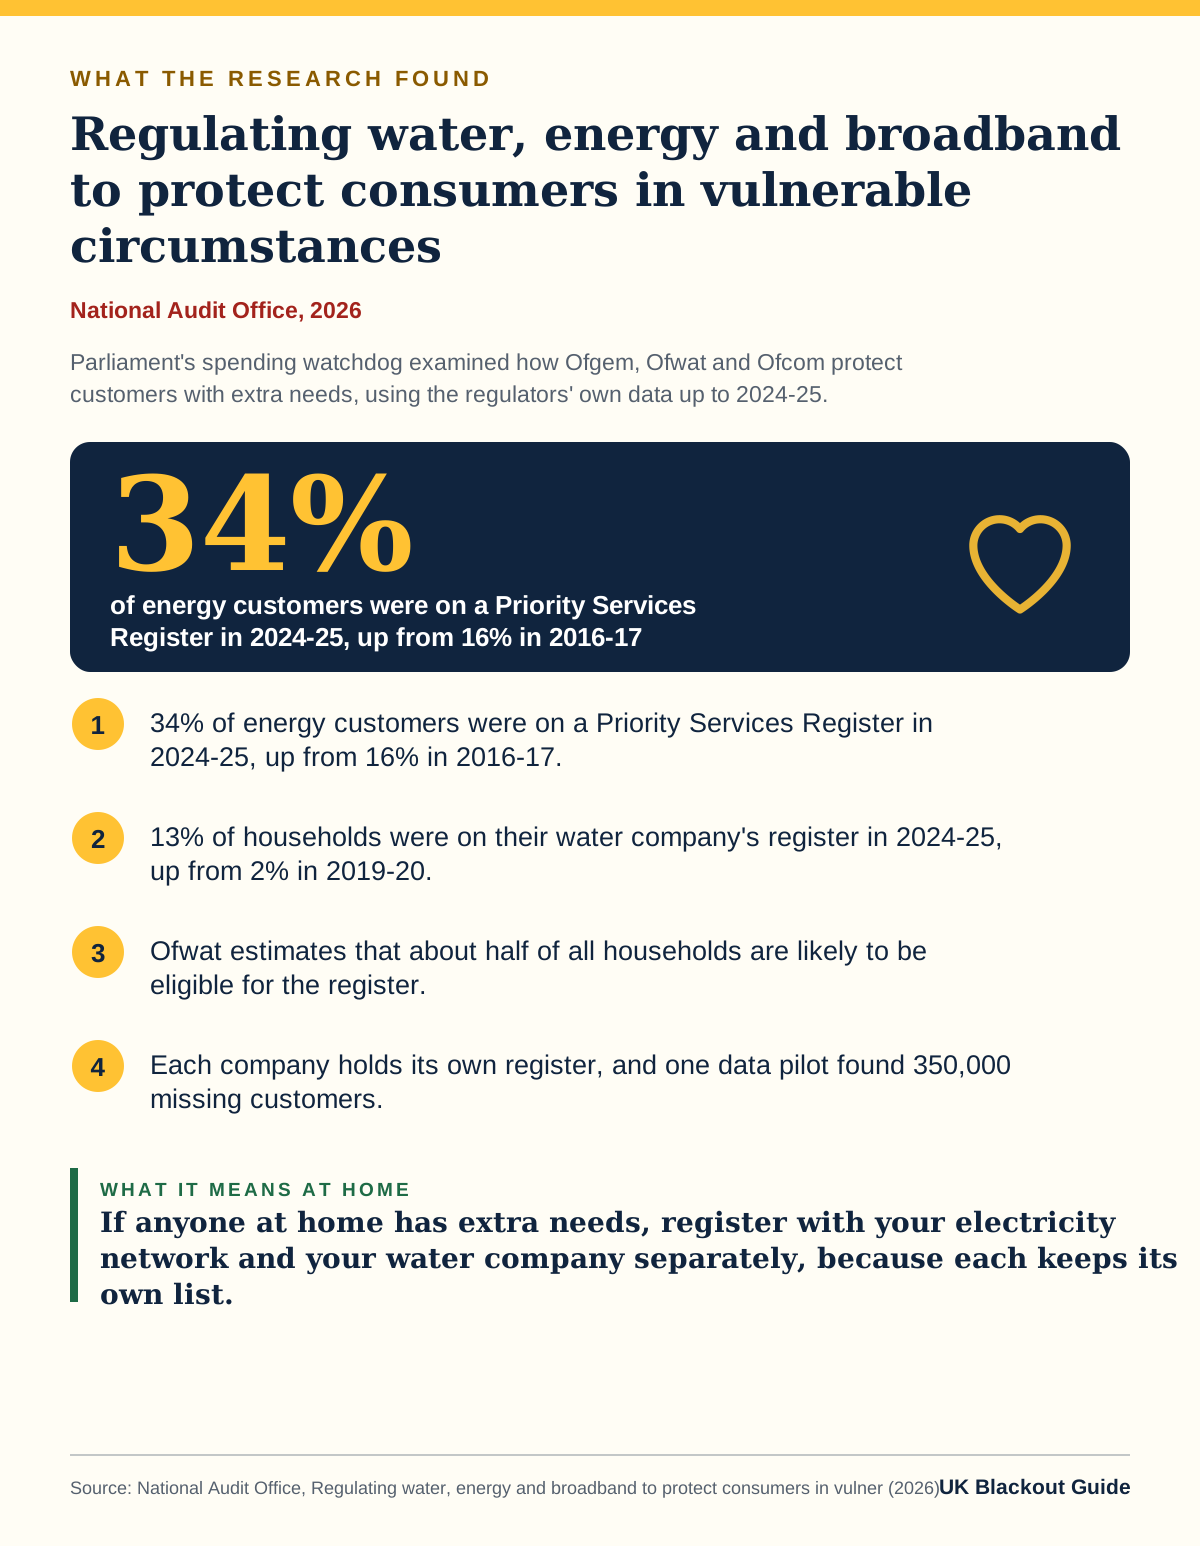
Infographic. National Audit Office, 2026: Regulating water, energy and broadband to protect consumers in vulnerable circumstances. Key figure: 34% of energy customers were on a Priority Services Register in 2024-25, up from 16% in 2016-17. Findings: 34% of energy customers were on a Priority Services Register in 2024-25, up from 16% in 2016-17. 13% of households were on their water company's register in 2024-25, up from 2% in 2019-20. Ofwat estimates that about half of all households are likely to be eligible for the register. Each company holds its own register, and one data pilot found 350,000 missing customers.
Regulating water, energy and broadband to protect consumers in vulnerable circumstances, National Audit Office (2026). Read the source · Download this graphic

Parliament's spending watchdog examined how Ofgem, Ofwat and Ofcom protect customers with extra needs, using the regulators' own data up to 2024-25. If anyone at home has extra needs, register with your electricity network and your water company separately, because each keeps its own list.

We draw on these findings in our guide on priority Services Register UK, where they sit alongside the practical steps.

General information only. This page is not professional, safety, medical, legal or financial advice, and it is not official guidance. No national blackout has been forecast or announced, and nothing here suggests one is expected. We are independent and have no connection to the government or any energy company. Always check the official sources linked on this page. Full disclaimer